
Bitcoin has climbed more than 2% to $63,770 after a ceasefire agreement between Israel and Hezbollah helped ease market fears and pushed oil prices toward an 8% weekly decline.
Summary
- Bitcoin price climbed 2.4% as a ceasefire deal and falling oil prices improved risk appetite.
- A symmetrical triangle breakout above $64,760 could open the door to a move toward $80,000.
- ETF outflows continue, but liquidation clusters above current prices could fuel further gains.
According to crypto.news data, Bitcoin (BTC) price climbed 2.4% to an intraday high of $63,770 on June 20 before easing slightly to around $63,600. The move followed a 7% decline from the June 15 high near $67,200 to a local low around $62,300 on June 18, a drop that coincided with ETF outflows, geopolitical uncertainty, and a broader flight from risk assets.
Fresh optimism emerged after reports that Israel and Hezbollah had agreed to a ceasefire scheduled to begin Friday. Reuters cited a U.S. official confirming the agreement, while Iranian officials signaled readiness to resume diplomacy with Washington if the terms are respected.
The developments reduced immediate fears of a wider regional conflict and helped drive crude oil prices toward an 8% weekly decline, with Brent and WTI benchmarks trading near multi-week lows.
Safe-haven assets such as gold and silver also lost momentum as investors rotated capital into higher-risk assets. Gold fell 1.6% over the past 24 hours while silver dropped roughly 2%, coinciding with Bitcoin’s recovery from weekly lows.
Options positioning and short covering add fuel to rebound
Derivatives traders have turned a technical bounce into a recovery rally. A large options expiry may also be contributing to the move. Nearly $10.6 billion in Bitcoin options are set to expire on June 26, with market participants closely watching the event after reports showed a significant portion of open interest sits above current prices.
The recovery has also forced short sellers to reduce exposure after Bitcoin briefly entered oversold territory following the June 18 selloff. Such conditions often trigger short-covering activity, where traders buy back borrowed assets to close bearish positions, adding upward pressure to BTC price.
CoinGlass liquidation data shows one of the largest nearby liquidation clusters sits around the $64,000-$65,000 area, directly above current prices.
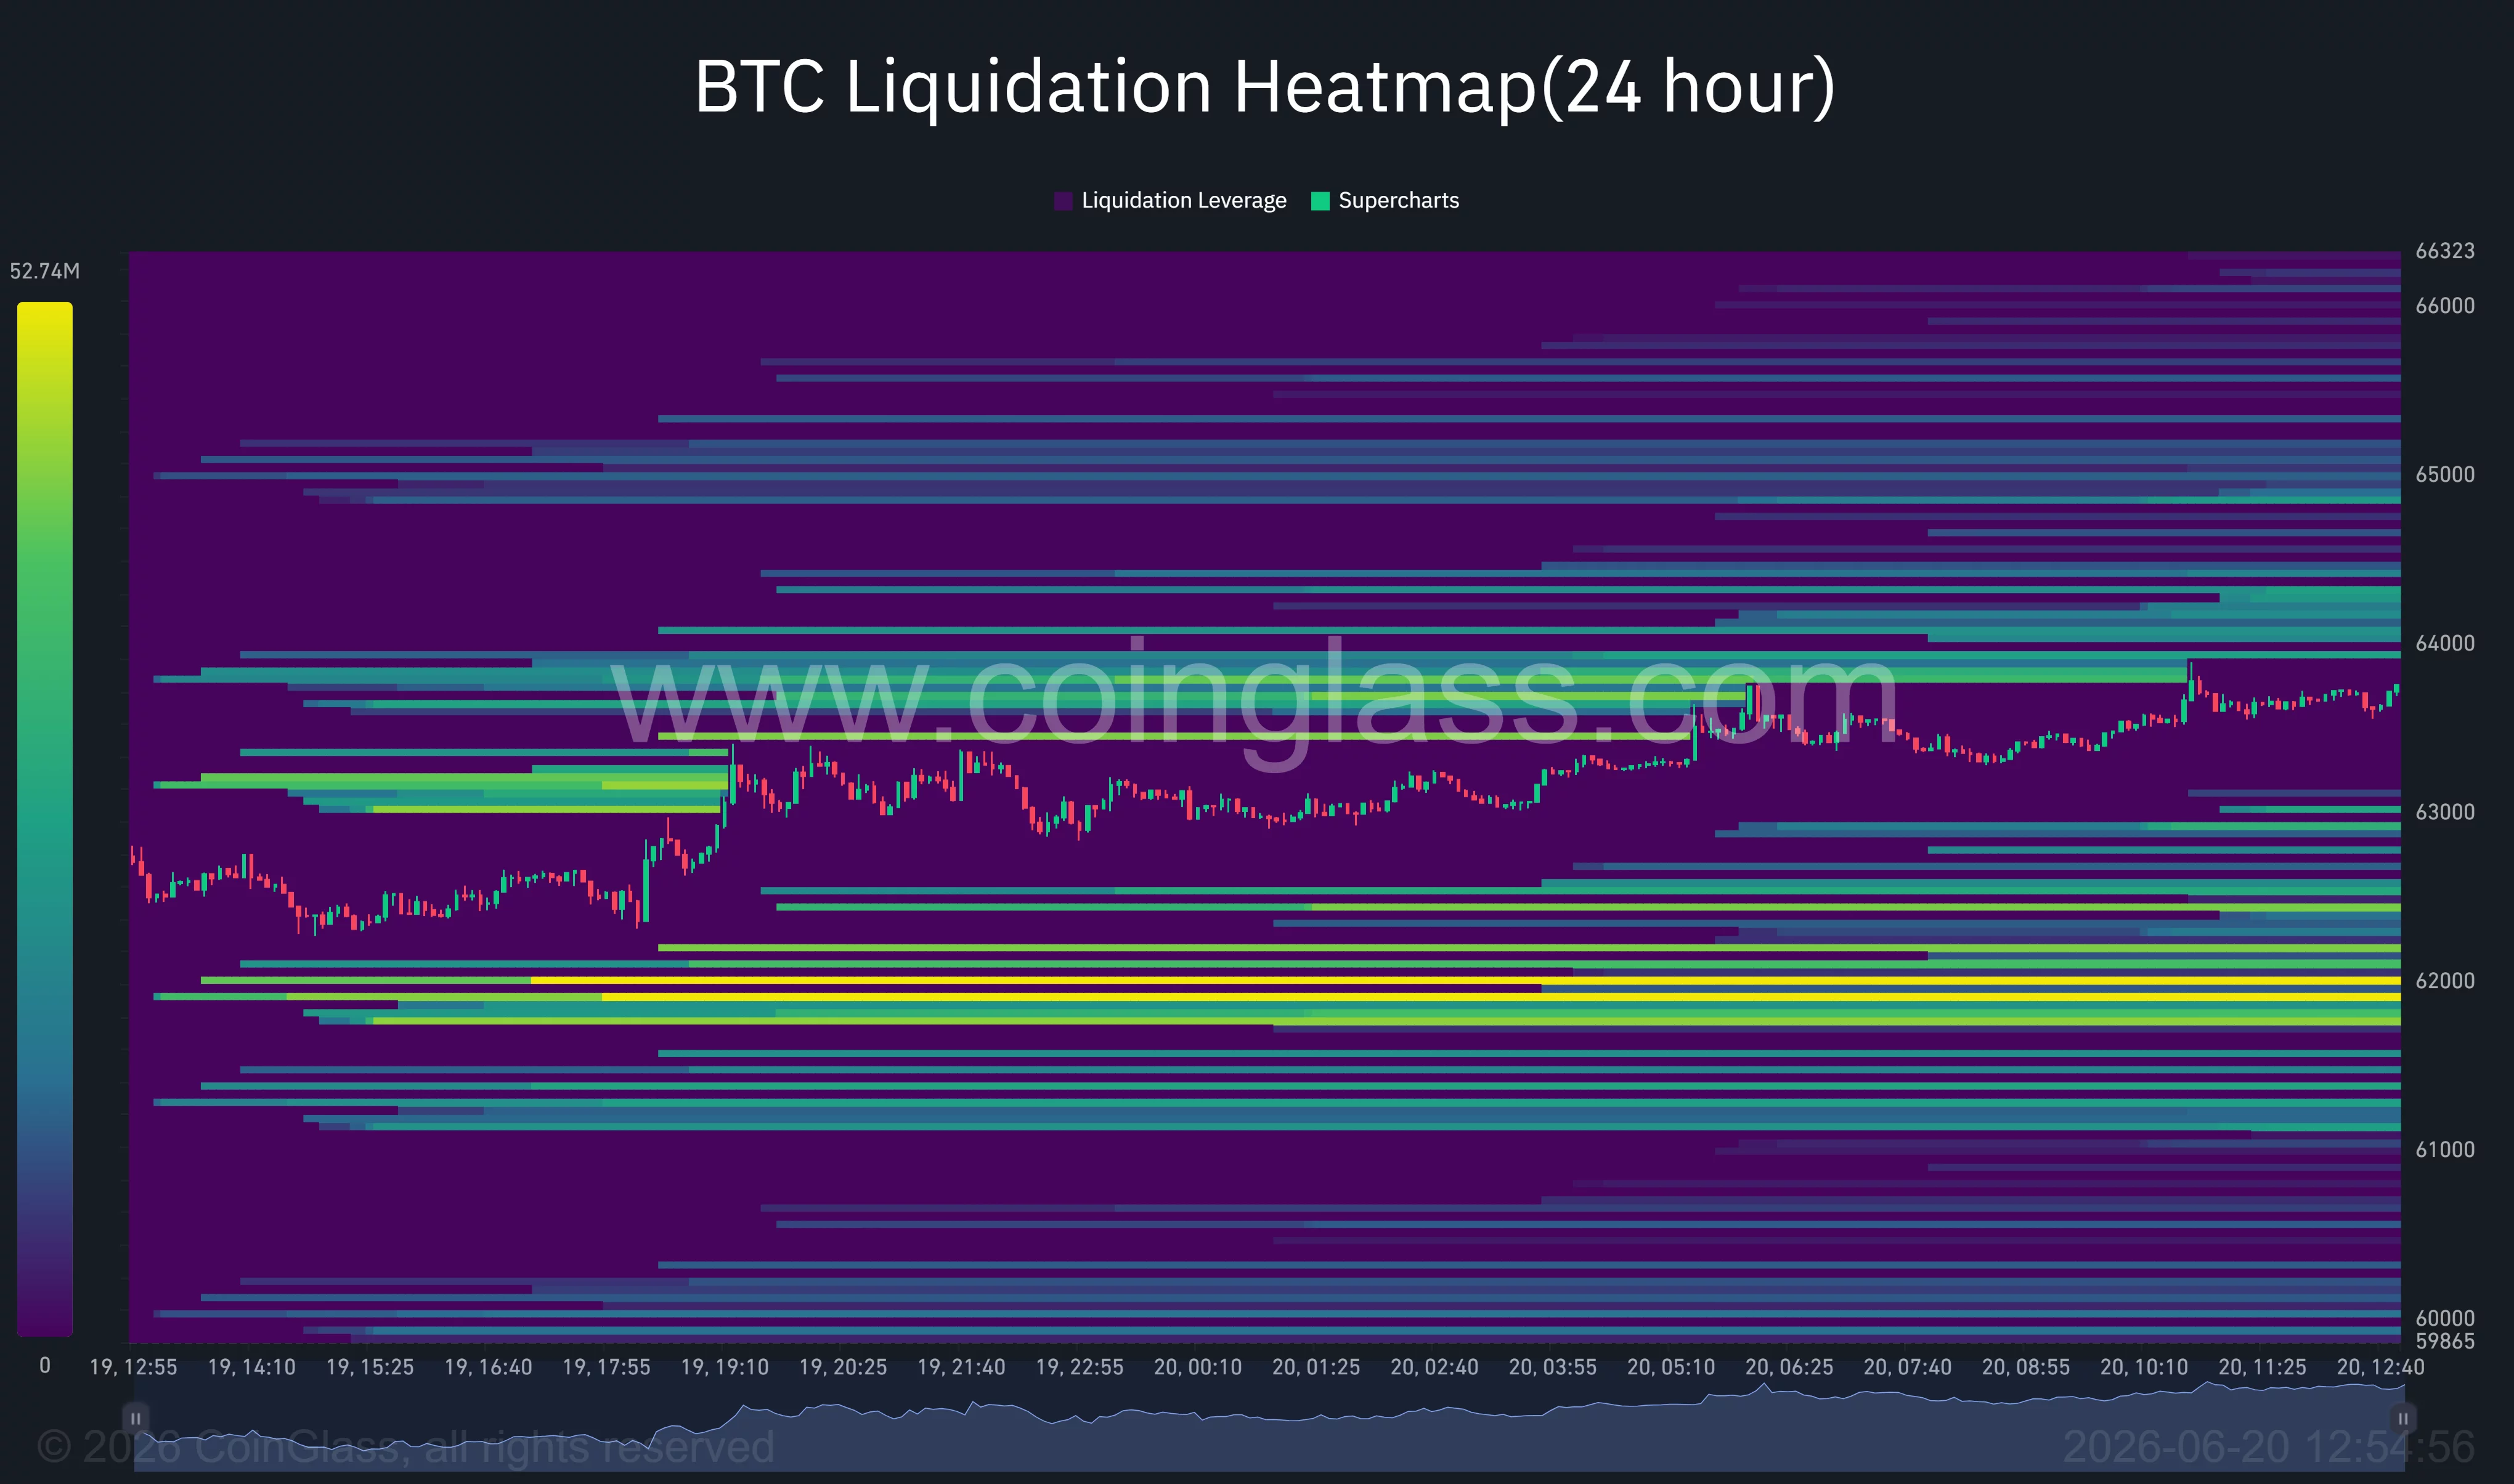
Additional liquidity pockets are visible near $66,000, suggesting that a sustained push higher could trigger another round of forced short liquidations and accelerate volatility.
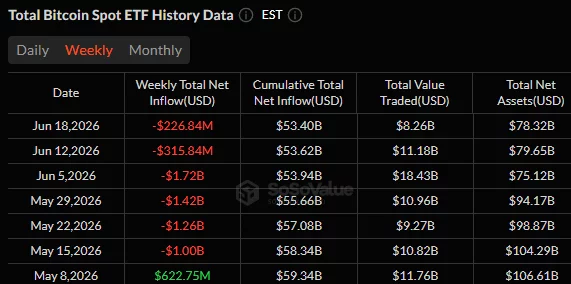
Institutional flows remain mixed. SoSoValue data shows that U.S. spot Bitcoin ETFs recorded more than $226 million in net outflows this week, extending a broader withdrawal trend that has persisted since mid-May. Although those flows remain a headwind, the pace of selling has slowed compared with the panic seen over the previous weeks.
A breakout above $64,700 could open a path toward $80,000
The technical picture has improved considerably on both daily and four-hour timeframes.
On the four-hour chart, Bitcoin is trading inside a symmetrical triangle formed by a descending resistance trendline from the June 15 peak and a rising support trendline extending from the June 5 low. Price has compressed toward the apex of the pattern, a structure that often precedes a large directional move.
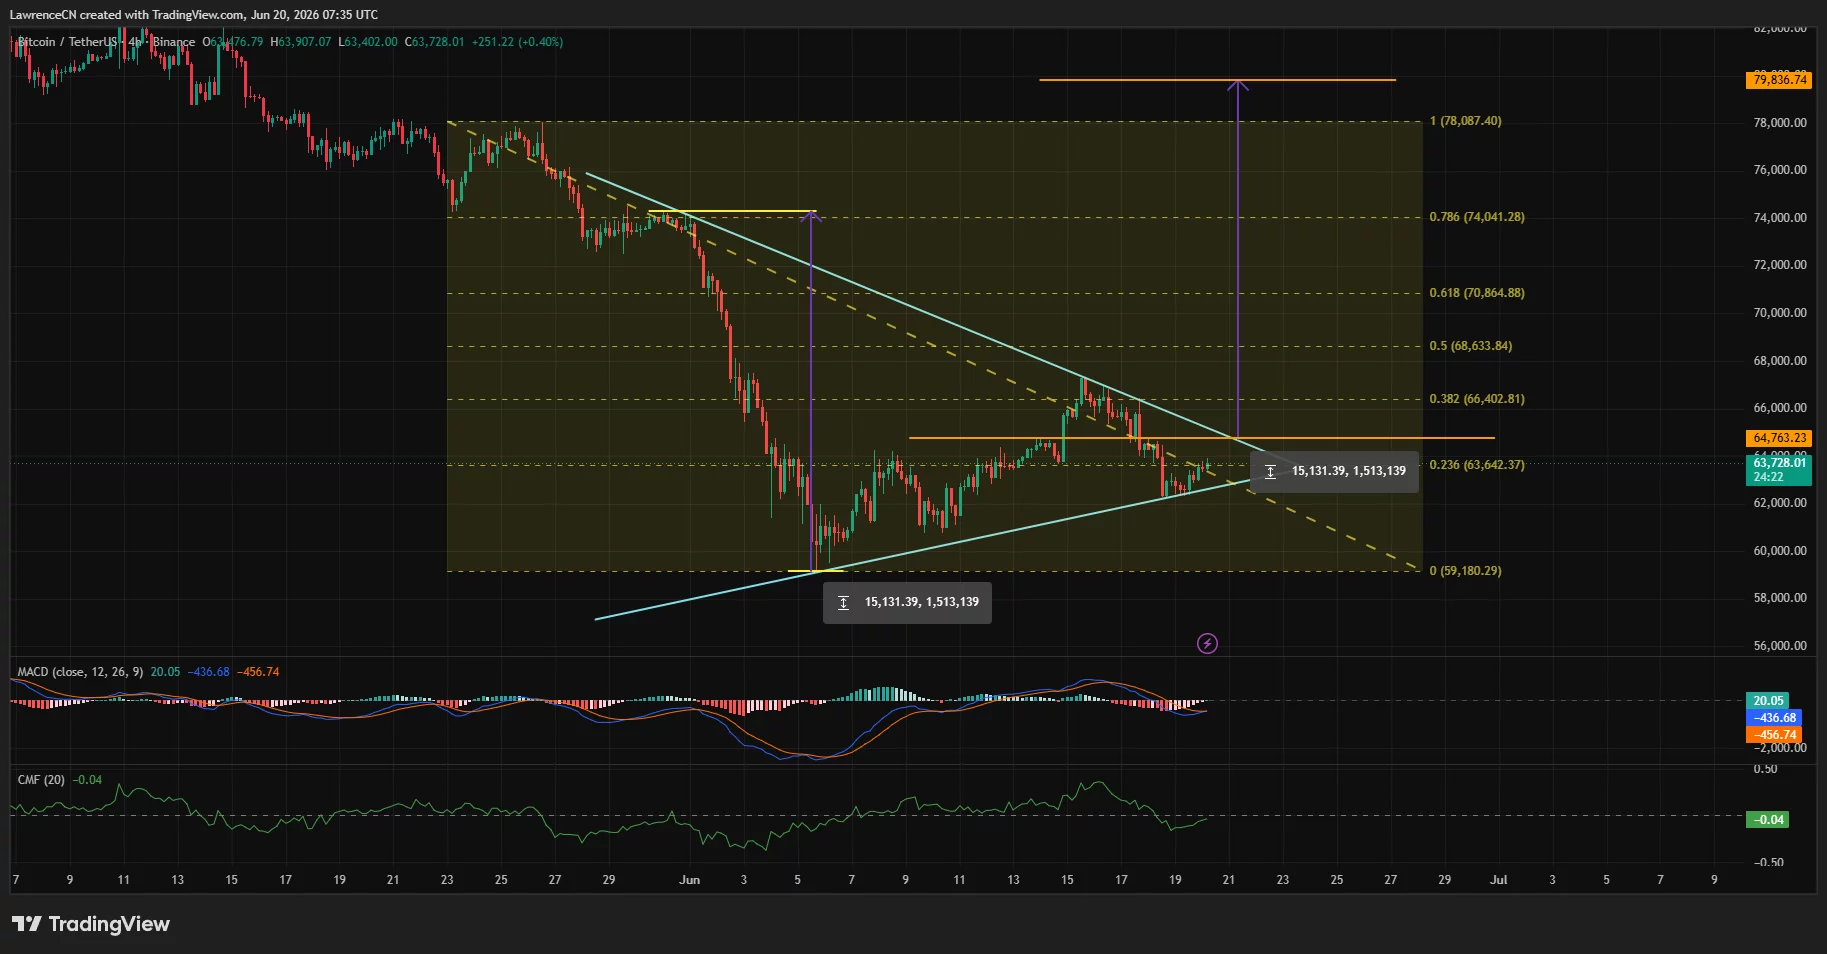
The key breakout level sits near $64,760. A decisive move above that area would place Bitcoin above both the triangle resistance and a major Fibonacci retracement level. The measured move target from the pattern projects toward the $79,000-$80,000 region, which also aligns with resistance near the upper Fibonacci extension visible on the chart.
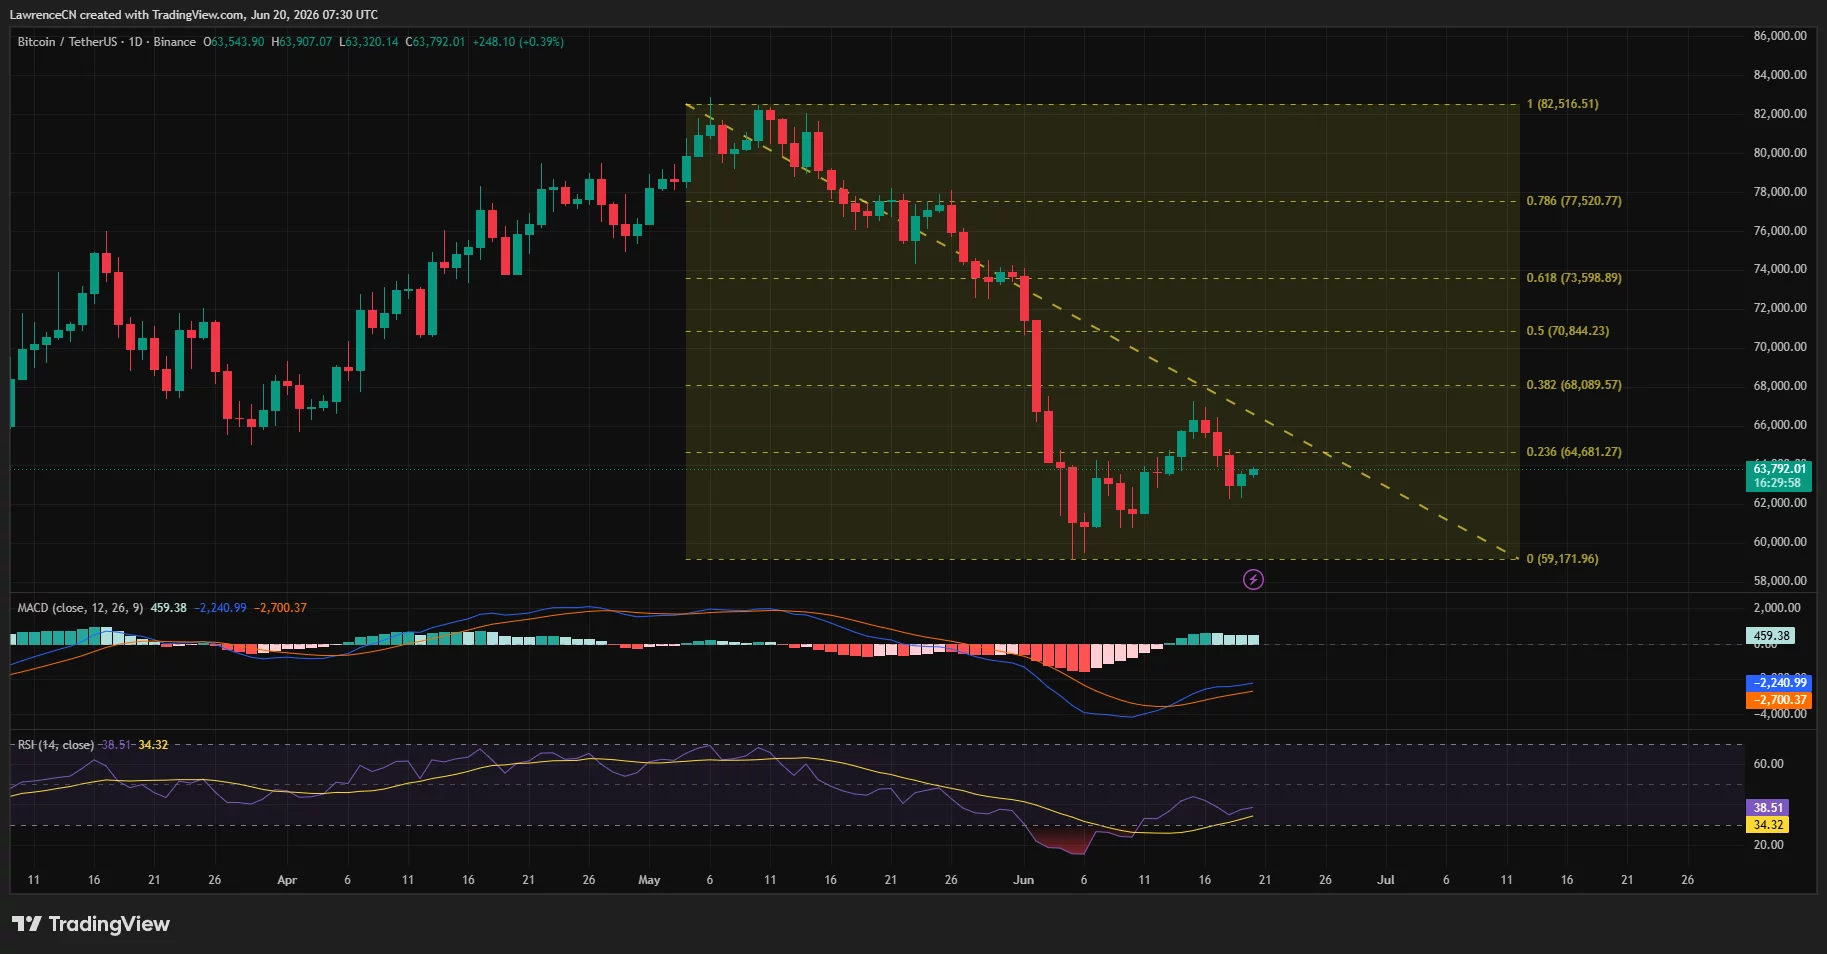
Daily momentum indicators have started to improve. The MACD histogram has printed consecutive higher readings after a prolonged decline, while the RSI has recovered from near-oversold conditions and climbed back above 38. Chaikin Money Flow remains slightly negative but has begun turning upward, suggesting selling pressure has eased compared with earlier in the month.
The bullish outlook would weaken if Bitcoin loses the triangle’s ascending support and falls below $62,000.
CoinGlass heatmap data shows a large concentration of liquidity around $61,800-$62,000, making that zone an important battleground for traders. A breakdown beneath it could expose the June low near $59,200 and shift momentum back in favor of bears.
Beyond the charts, traders continue to monitor U.S.-Iran negotiations, Federal Reserve policy expectations, and ETF flows. Any renewed escalation in the Middle East, a rebound in oil prices, or another wave of institutional selling could limit Bitcoin’s recovery and delay a breakout attempt.