Bitcoin price traded near $62,600 at press time, according to crypto.news market data.
Summary
- OG investors cut Bitcoin selling, reducing one pressure source near the key $60,000 support area.
- Binance inflows still show panic selling, with $479 million in possible BTC supply nearby.
- ETF outflows have slowed, but traders still need daily closes above $63,000 for confidence.
BTC was up 0.31% in 24 hours but remained down 4.38% over seven days. Daily trading volume stood near $23.99 billion, while market cap held close to $1.25 trillion.
The price action came as CryptoQuant data showed a sharp drop in selling by older Bitcoin holders. These wallets, often called OG investors, have held BTC for more than five years and usually move coins during major profit-taking periods.
“Today, the 90-day average of BTC spent by these OGs has dropped below 1,000, sitting at 962, its lowest level since November 2024,” said CryptoQuant analyst Darkfost.
The drop matters because older holders sold heavily during the last two years. CryptoQuant data showed peaks in May 2024, February 2025 and September 2025. Some single days saw more than 10,000 BTC, 30,000 BTC and even 142,000 BTC move.
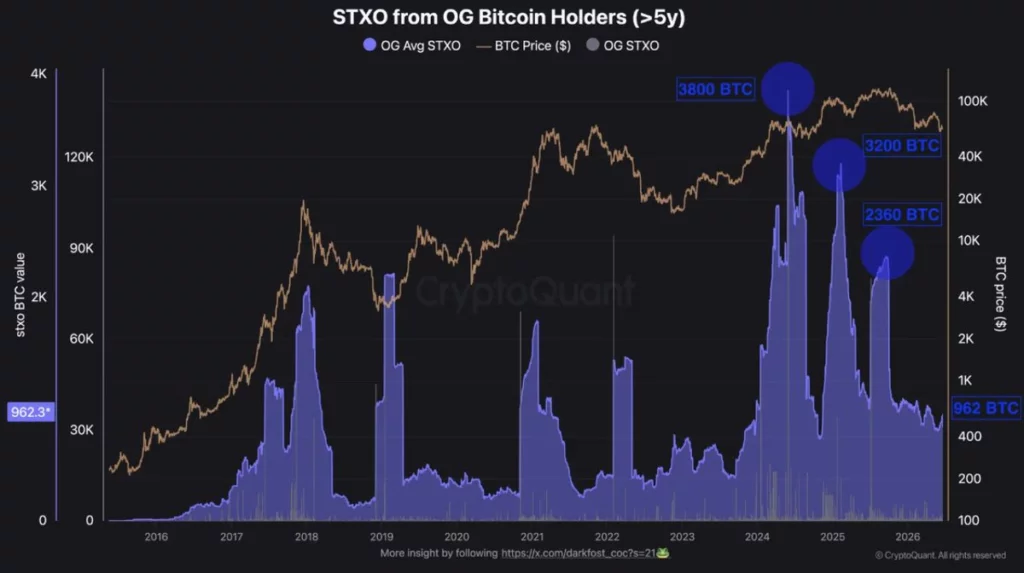
When long-term holders move old coins, traders often read it as a sign of possible selling. Their slower activity now suggests one major source of supply pressure has eased near current prices.
Bitcoin price faces key test at $60,000 support
Bitcoin’s current range keeps attention on the $60,000 level. Analyst Ali Martinez said on-chain data shows more than 1.3 million BTC changed hands between $60,000 and $63,000. That makes the area the largest volume cluster on the chart.
“Immediate support at $60,587 must hold to maintain the current trend,” said crypto analyst Ali. “A break below it opens a path to $46,702.”
The same analysis pointed to lower high-volume zones near $46,702 and $37,867. Those levels could become important if BTC loses the current support block and closes below $60,000 with strong selling volume.
Bitcoin has already shown weakness near that area. As previously reported by crypto.news, BTC confirmed a bearish head-and-shoulders pattern and put the $60,000 support zone under pressure. That report said a break below $60,000 to $60,600 could expose a deeper move toward $57,500.
The current setup gives traders two different signals. OG selling has slowed, which can reduce supply. At the same time, technical structure still requires buyers to defend the lower edge of the range.
Binance inflows show panic risk
CryptoQuant analyst Darkfost also reported a rise in BTC flows into Binance after the recent move below $60,000. He said average monthly inflows doubled from 3,880 BTC to 7,600 BTC since April 13.
At a price near $63,000, that equals about $479 million in possible sell-side pressure on Binance alone. The data suggests some holders still move coins to exchanges when BTC drops below key levels.
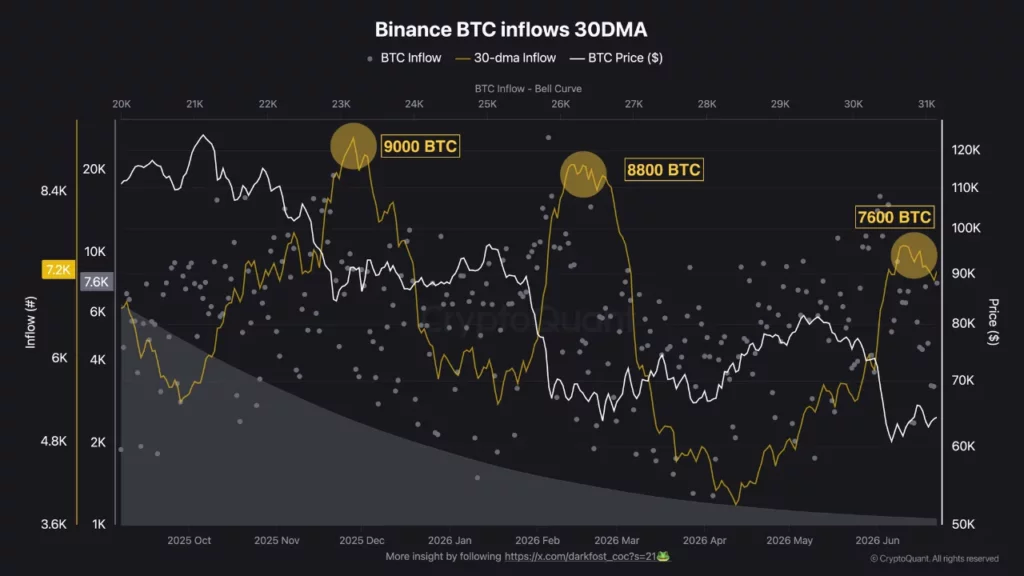
Darkfost said the pattern has appeared before during the current bear market. Binance inflows rose above 9,000 BTC when BTC fell to $84,000 in November 2025 and reached about 8,800 BTC during the $60,000 test in February 2026.
“The $60,000 level has gradually become a genuine battleground,” said CryptoQuant analyst Darkfost.
That battle now sits between short-term sellers and stronger holders. Some investors move coins to exchanges during fear-driven drops. Others may use the same weakness to accumulate.
The recent inflows remain high, but Darkfost noted that they tend to decrease as the correction continues. If that pattern holds, selling pressure may keep fading even if price remains weak.
Market signals remain mixed
Spot Bitcoin ETF outflows have also slowed over the past two weeks, which gives the market some relief. ETF flows had weighed on BTC earlier this month as institutional demand weakened and risk appetite cooled.
The broader crypto market also remains soft. Ether traded near $1,665, XRP near $1.10 and Solana near $69 on crypto.news market pages. Hyperliquid’s HYPE remained under pressure, while Tron held up better over the week.
Analyst David said Bitcoin still trades below its longer-term adoption structure. He said spot BTC stood near $62,700, while a 4.1-year adoption spine sat near $76,400 and a power-law trend sat near $134,000.
“Short term: cycles dominate. Long term: adoption dominates,” said analyst David.
For now, Bitcoin’s near-term test remains simple. Bulls need to hold the $60,000 to $63,000 volume block and reclaim higher levels with daily closes above the range. Bears need a clean break below $60,000 to push the market toward lower support.
OG selling has cooled, but exchange inflows and weak technical structure show that Bitcoin has not cleared the danger zone yet.
Disclosure: This article does not represent investment advice. The content and materials featured on this page are for educational purposes only.