
Ethereum price is showing signs of resilience as institutional appetite returns.
Summary
- U.S. spot Ethereum ETFs logged $421M in inflows on Oct. 7, marking seven consecutive days of positive flows.
- Exchange reserves have fallen to a three-year low of 17.4M ETH, amplified by corporate holdings and EIP-1559 burns.
- ETH trades near $4,450, consolidating above support with RSI at 53, hinting at a possible retest of $4,900–$5,000 if momentum builds.
Amidst a general market decline, Ethereum was down 5.3% over the last day, trading at $4,443 at the time of writing. Even with the decline, ETH is still up 7% for the week and 3.4% for the month, and it is just 10% below its peak of $4,946 on Aug. 24.
The token has had moderate volatility over the last seven days, ranging from $4,133 to $4,748. Rather than a trend reversal, this points to a period of consolidation. Trading activity has increased with 24-hour spot volume at $51.9 billion, up 27% from the previous day.
According to Coinglass data, Ethereum (ETH) futures volume rose 54% to $124.2 billion, while open interest fell 5.5% to $60.3 billion. The decline in open interest, indicates that leveraged positions were flushed out, which is often a precursor to renewed price stability.
Spot ETH ETF inflows could drive momentum
Spot Ethereum ETFs are still drawing consistent inflows. SoSoValue data shows net inflows of $420 million on Oct. 7, the seventh day in a row of positive activity., The combined assets of the spot Ethereum ETFs now exceed $30 billion, with inflows totaling $803 million in the past month.
Despite short-term volatility, these inflows indicate that institutional confidence in Ethereum has remained strong. Constant demand for ETFs helps absorb circulating supply and mitigate negative movements. As institutional exposure increases, analysts predict that if the trend continues through October, it may help a medium-term price recovery.
With corporate treasuries and ETFs absorbing supply, exchange reserves have already dropped to a three-year low of 17.4 million ETH from 28.8 million in 2022. Public companies now hold around 3.6 million ETH, adding to the supply squeeze.
Additionally, the ongoing EIP-1559 burn mechanism, which permanently eliminates a portion of transaction fees, is making Ethereum’s supply dynamics more deflationary.
Ethereum price technical analysis
Ethereum’s daily chart shows a steady consolidation pattern within the Bollinger Bands, with a price o $4,450, just above the mid-band at $4,313, which is currently acting as short-term support. The upper band, which is near $4,731, is the next resistance to watch.
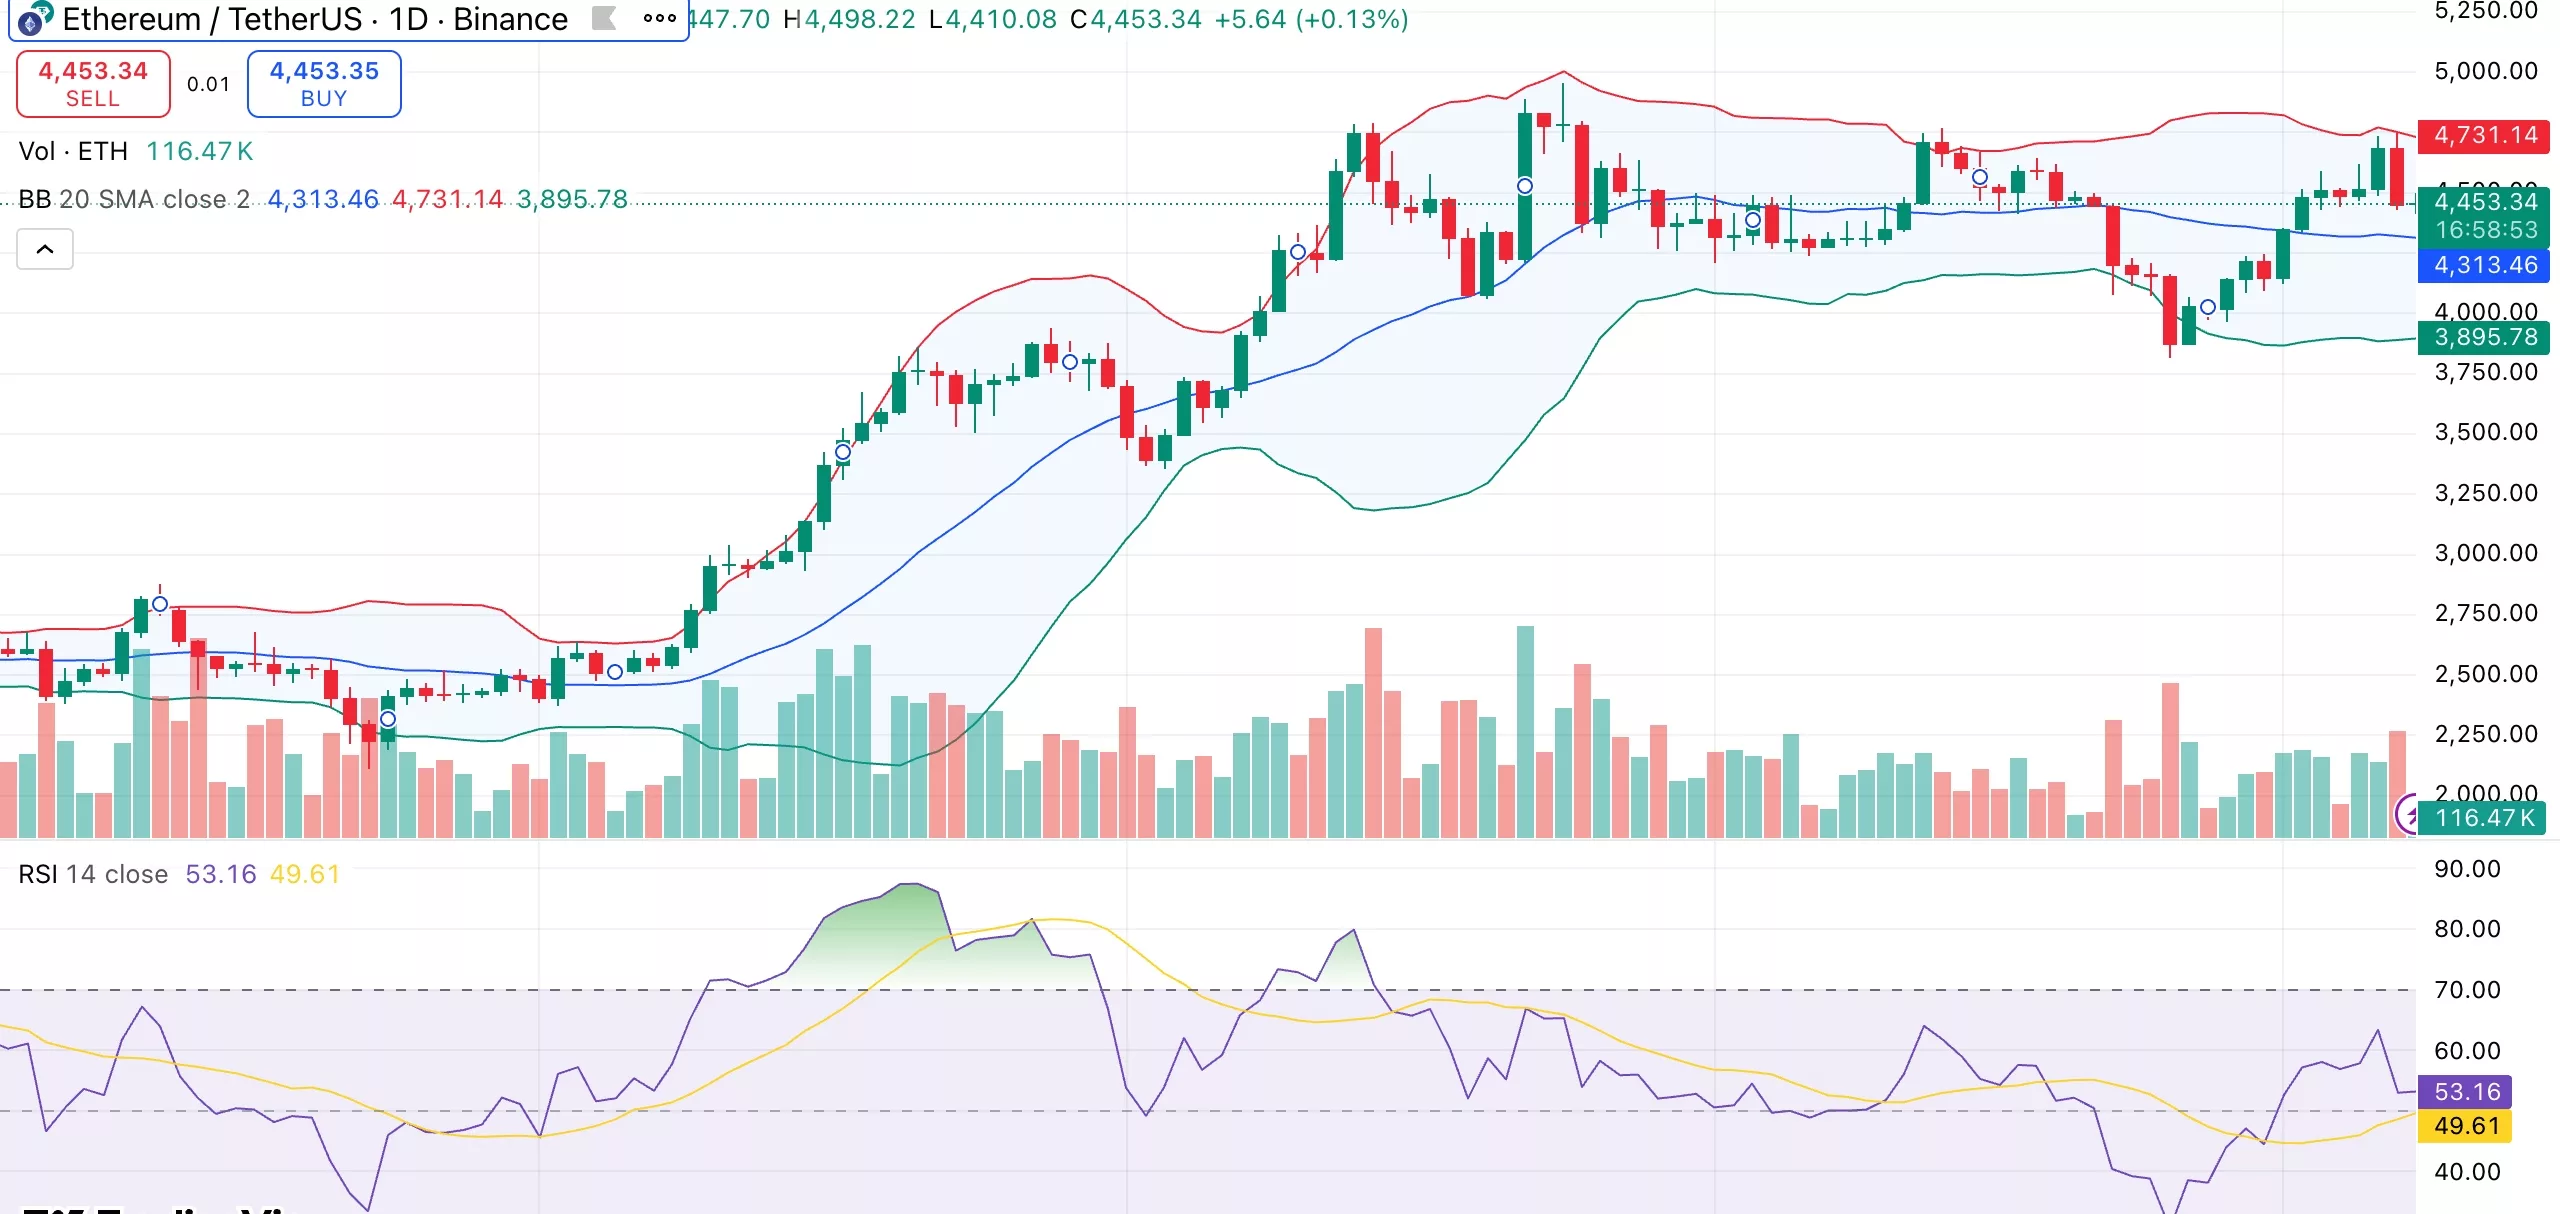
The fact that trading volumes are still strong indicates that ETH is stabilizing following recent volatility. At 53, the Relative Strength Index (RSI) indicates that the market is balanced and neither overbought nor oversold. Given this neutral momentum, Ethereum may be getting ready for its next significant move once volatility contracts further.
If bulls can push above $4,700, ETH may swiftly retest the $4,900–$4,950 range, which would correspond with the August high and suggest a possible continuation toward the psychological $5,000 level, In contrast, a close below $4,300 could lead to $3,900, the point at which the 50-day moving average and the lower Bollinger Band converge.