Architectural Concept Design Collection

  • CONTACT
  • MARKETCAP
  • BLOG
Finances Investing and Crypto News
  • BOOKMARKS
  • Finance
  • Investment
  • Crypto
    • Bitcoin
    • Blockchain
    • Ethereum
    • Forex
    • Tether
  • Market
    • Binance
    • Business
    • Investor
    • Money
    • Trading
  • News
    • Mining
    • NFT
    • Stocks
Reading: Ethereum price chart points to a comeback as exchange reserves dip
Share
  • bitcoinBitcoin(BTC)$95,064.08
  • ethereumEthereum(ETH)$3,134.36
  • tetherTether USDt(USDT)$1.00
  • rippleXRP(XRP)$2.26
  • binancecoinBNB(BNB)$923.21
  • solanaSolana(SOL)$140.76
  • usd-coinUSDC(USDC)$1.00
  • tronTRON(TRX)$0.293757
  • dogecoinDogecoin(DOGE)$0.159480
  • cardanoCardano(ADA)$0.50
Finances Investing and Crypto NewsFinances Investing and Crypto News
0
Font ResizerAa
  • Finance
  • Investment
  • Crypto
  • Market
  • News
Search
  • Finance
  • Investment
  • Crypto
    • Bitcoin
    • Blockchain
    • Ethereum
    • Forex
    • Tether
  • Market
    • Binance
    • Business
    • Investor
    • Money
    • Trading
  • News
    • Mining
    • NFT
    • Stocks
Have an existing account? Sign In
Follow US
© Foxiz News Network. Ruby Design Company. All Rights Reserved.
Finances Investing and Crypto News > Blog > Crypto > Ethereum > Ethereum price chart points to a comeback as exchange reserves dip
EthereumMarket

Ethereum price chart points to a comeback as exchange reserves dip

admin
Last updated: 21/10/2025 8:24 Chiều
admin
Published 21/10/2025
Share


Contents
Ethereum price chart analysisETH supply in exchanges is falling

Ethereum’s price remained under increased pressure this week as ETF outflows rose and sentiment in the crypto industry worsened.

Summary

  • Ethereum price has formed a big bullish flag pattern.
  • It has remained above the 200-day moving average, pointing to a rebound.
  • The supply of Ether tokens on exchanges has dropped to a multi-year low.

Ethereum (ETH) was trading at $3,900 at press time, down more than 21% from its highest point in September. Still, technical analysis suggests that the price may be ripe for a strong advance soon.

Ethereum price chart analysis

The daily timeframe chart shows that Ethereum’s price has pulled back in the past few months. The price has dropped from a high of $4,963 in August to $3,900 today.

The coin has moved below the important support level at $4,087, which was the highest point on Dec. 6 and Dec. 24 last year. The price also moved below the 50-day Exponential Moving Average.

On the positive side, Ethereum has held steady above the 200-day moving average at $3,570. The price has also formed a bullish flag pattern, which often leads to a strong bullish breakout.

The price is now in the descending channel of this pattern after completing the flagpole. Also, the coin is slightly above the Major S/R pivot point at $3,750.

Therefore, the token will likely bounce back in the coming days, with the initial target at the weak stop-and-reverse point of the Murrey Math Lines tool. A move above that level will point to more gains, potentially to the ultimate resistance at $5,000.
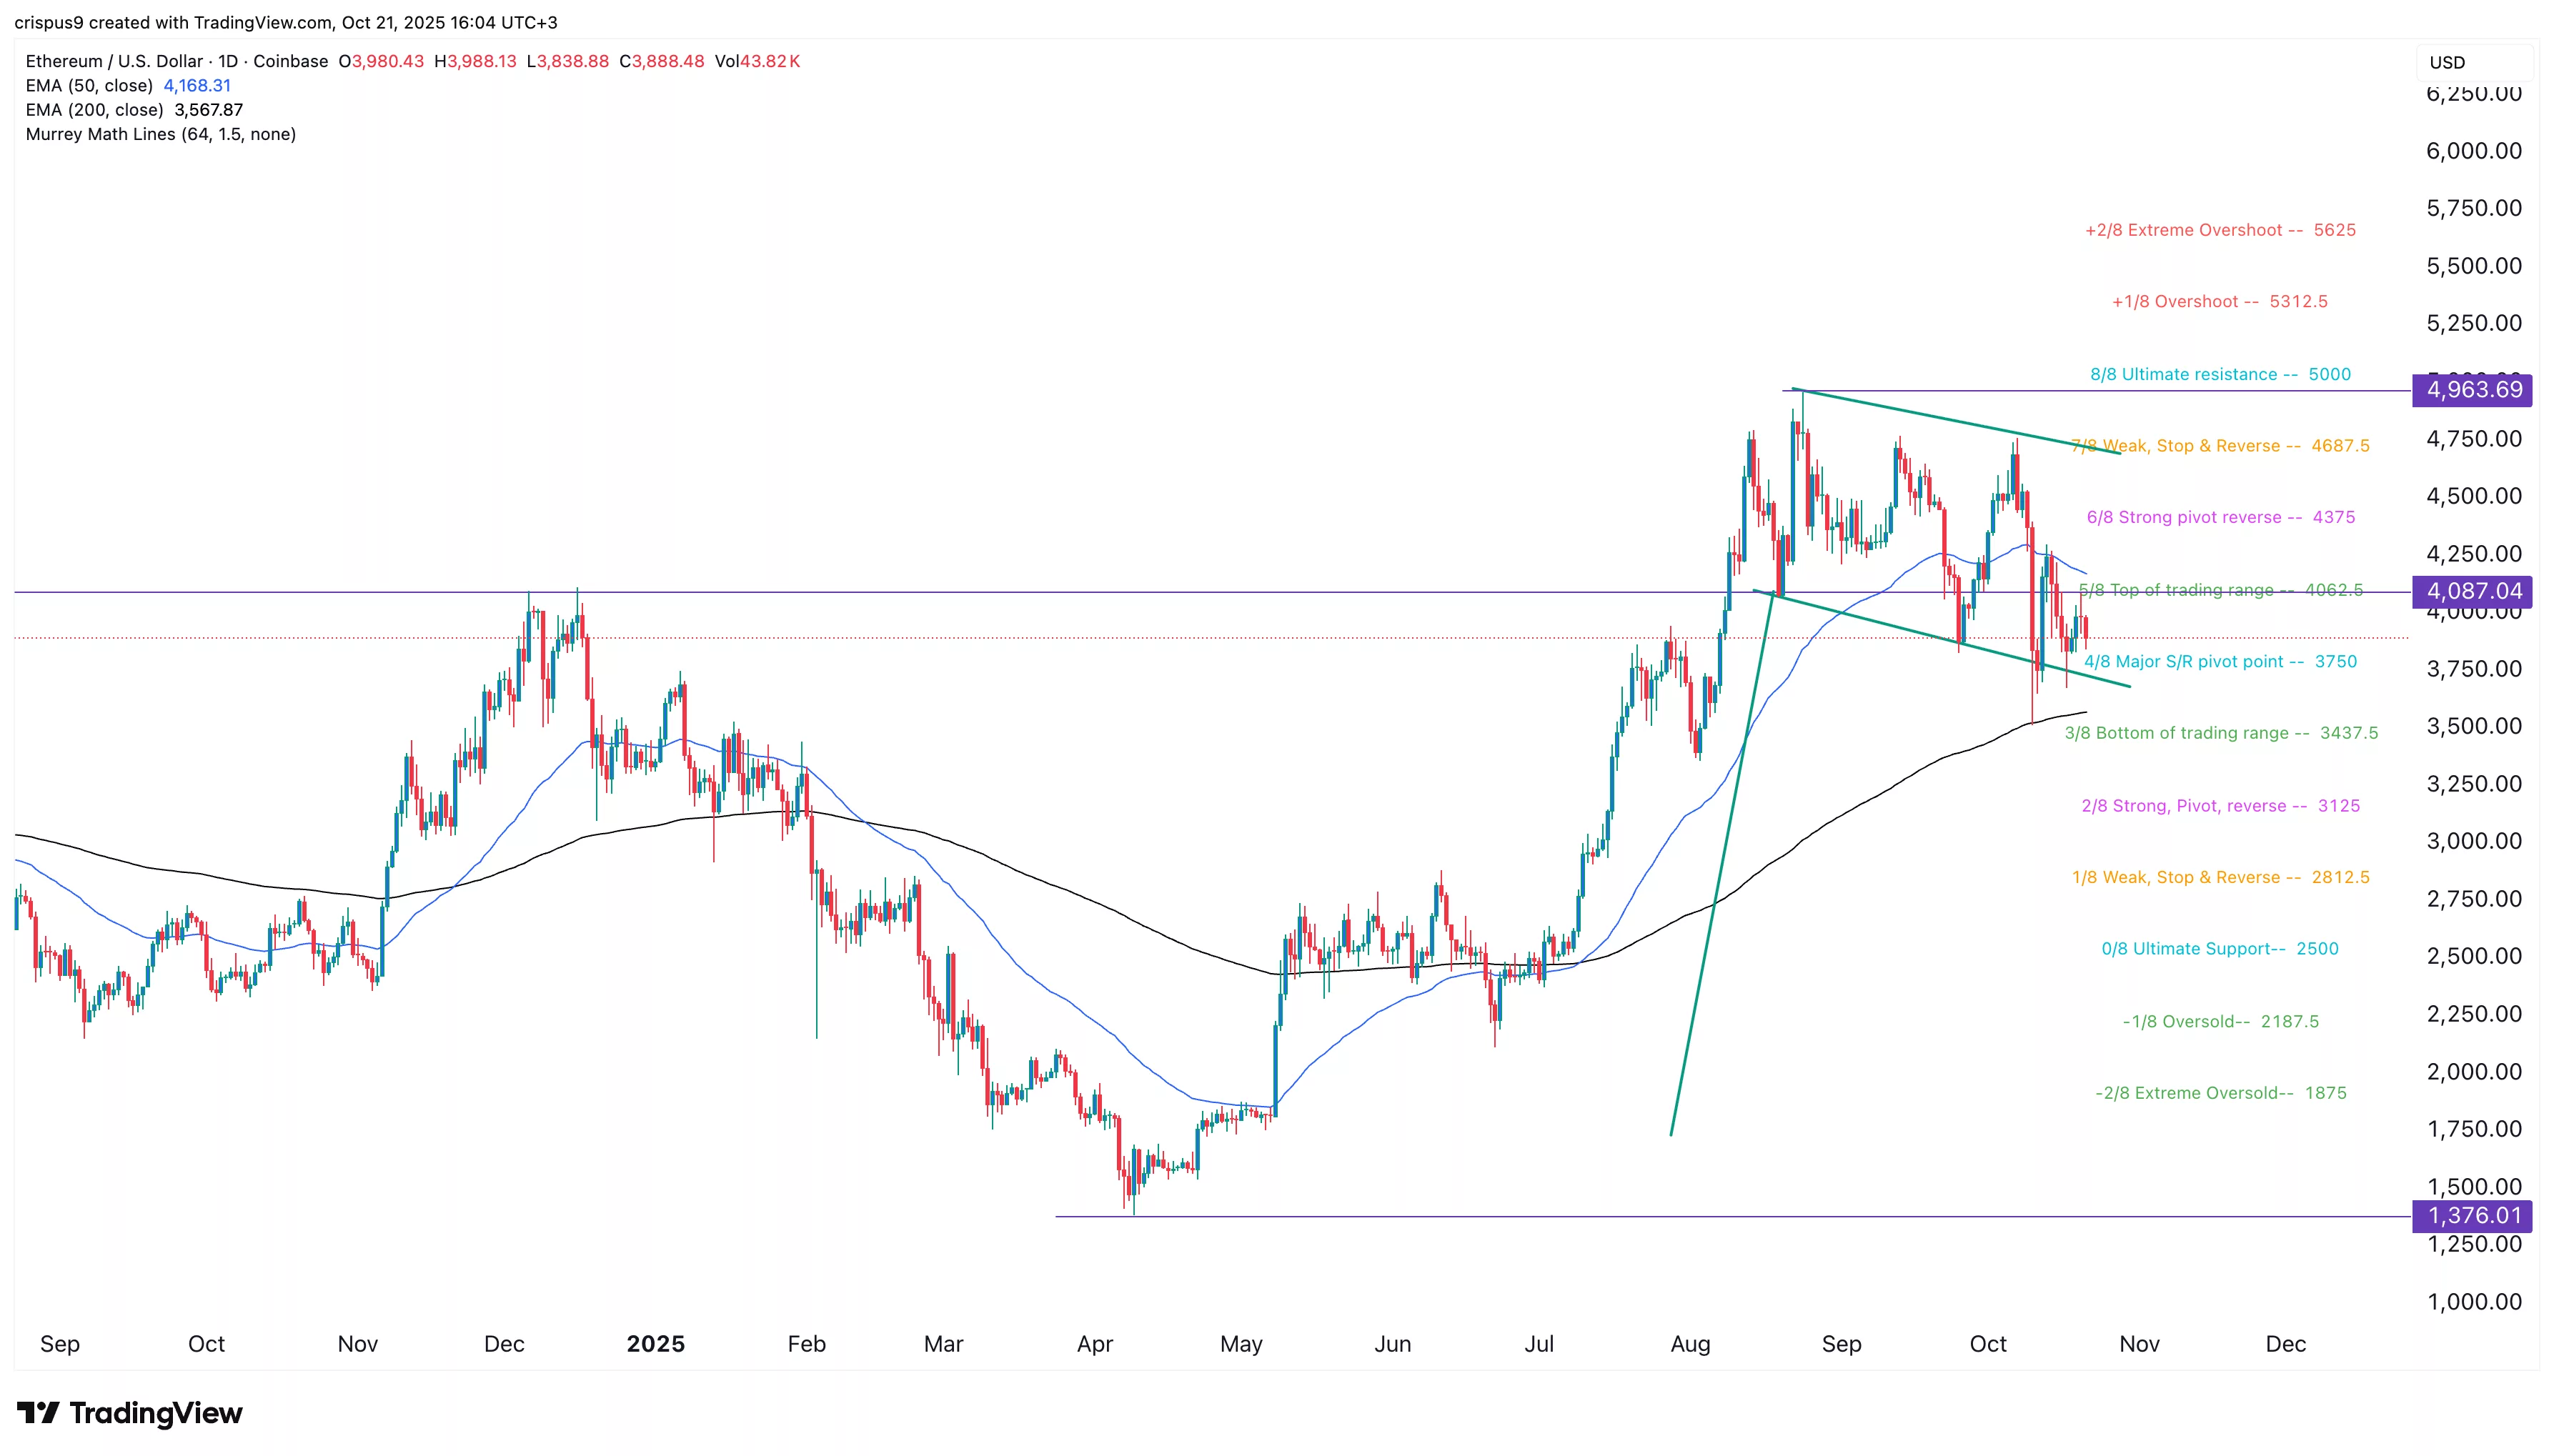
Ethereum price
ETH price chart | Source: crypto.news

ETH supply in exchanges is falling

One of the top catalysts for Ethereum price is that there is robust demand from investors despite the recent ETF outflows. Data shows that these funds have had over $14 billion in inflows since their inception in July last year. They now hold coins worth about $26 billion or 5.56% of the market cap.

Another sign of Ethereum demand is that exchange balances have continued falling this year. Exchange balances have plunged from 27 million in 2022 to 15.9 million today. Falling exchange reserves are a sign that investors are moving their coins to self-custody.

Meanwhile, more investors are staking ETH coins. StakingRewards data shows that the staking market cap stands at $140 billion, while the staking ratio is at 30%.

Ethereum’s network is doing well, especially in the stablecoin industry. Stablecoin supply has jumped by 1.35% in the last 30 days to $167 billion, while the adjusted transaction volume hit $1 trillion.

You Might Also Like

Bottom G? Behind Andrew Tate’s $583k trading loss

is alt-season around the corner?

Top 3 reasons the soaring Cronos price is due for a correction

Dow Jones up 350 points on signs of Israel-Iran de-escalation, EU trade talks

Why is Bitcoin price up today? The hidden fuel behind BTC’s $109k breakout

TAGGED:chartcomebackdipEthereumexchangepointspricereserves

Sign Up For Daily Newsletter

Be keep up! Get the latest breaking news delivered straight to your inbox.
By signing up, you agree to our Terms of Use and acknowledge the data practices in our Privacy Policy. You may unsubscribe at any time.
Share This Article
Facebook Email Copy Link Print
Previous Article Top reasons Pepe Coin price is at risk of a steeper crash
Next Article Here’s why GLXY stock price soared to an ATH after earnings
Leave a Comment

Để lại một bình luận Hủy

Email của bạn sẽ không được hiển thị công khai. Các trường bắt buộc được đánh dấu *

Follow US

Find US on Socials
FacebookLike
- Advertisement -
Ad image
Popular News
Emergency Funds: Importance and How to Build One
Debt Management: Strategies to Pay Off Debt Efficiently
Riot Platforms unloads 475 BTC in its biggest single-month Bitcoin sale to date
Revolut partners with Lightspark to add Bitcoin Lightning for UK and EEA users
Here’s why altcoins like Stacks, Flare, Jasmy, and Dogecoin rising
- Advertisement -
Ad image

Follow Us on Socials

We use social media to react to breaking news, update supporters and share information

Twitter Youtube Telegram Linkedin
Finances Investing and Crypto News

FICN.net brings you the latest in finance, investment, and crypto. Stay informed with expert insights, market analysis, and beginner guides. Whether you're new or experienced, FICN.net helps you explore opportunities, manage risks, and make smarter financial decisions in a fast-changing world.

Subscribe to our newsletter

You can be the first to find out the latest news and tips about trading, markets...

Ad image
© 2024 Finance, Investment, and Crypto News. All Rights Reserved.
Welcome Back!

Sign in to your account

Username or Email Address
Password

Lost your password?