
Bitcoin price is showing early signs of a possible trend shift after a key on-chain indicator flashed a rare bullish signal, even as the market continues to consolidate.
Summary
- Bitcoin’s Inter-exchange Flow Pulse crossed above its 90-day moving average for the first time since early 2025.
- BTC is consolidating between $67K and $72K after a sharp drop from the $95K region.
- A breakout above $72K could open the path toward the $75K–$78K resistance zone.
Bitcoin (BTC) was changing hands at around $70,080 at the time of writing. That represents a 3.7% decline over the past 24 hours. Even so, the price remains close to the top of its weekly trading band, which currently spans from $63,176 to $73,669.
Short-term weakness hasn’t erased the gains seen over the past week. BTC is still up about 5.8% during that period. Over the last month, however, the trend is slightly negative, with the asset down around 8%. Compared with its October 2025 peak of $126,080, Bitcoin is still trading roughly 44% below its all-time high.
Market participation has also slowed. During the last 24 hours, trading volume dropped to $47.99 billion, a decline of more than 32%. Such pullbacks in activity are common during consolidation phases, when traders step back and wait for clearer direction.
The derivatives market tells a similar story. Data from CoinGlass shows trading volume in derivatives contracts falling by 23% to $72 billion. Open interest also slipped, declining 8% to $45 billion as some leveraged positions were closed.
IFP indicator signals renewed risk appetite
Amid this quieter market environment, fresh on-chain data is drawing attention. Analysts at CryptoQuant report that Bitcoin’s Inter-exchange Flow Pulse has moved above its 90-day moving average.
The shift marks the first time the metric has crossed that level in roughly a year, according to a March 6 report by CryptoQuant contributor RugaResearch.
To understand why this matters, it helps to look at what the indicator measures. The IFP tracks Bitcoin transfers between spot exchanges and derivatives platforms.
A rise in flows toward derivatives venues often signals that traders are preparing leveraged positions in anticipation of potential upside. When the movement heads toward spot exchanges instead, speculation in the market usually declines.
Looking back at historical data adds more context. Since 2016, similar IFP crossovers have frequently appeared near the early stages of bullish cycles. That said, the signal does not always translate into immediate price rallies. In some cases, the market took time to react.
The indicator had spent nearly a full year below its long-term average before this latest development. It turned bearish in early 2025 and remained there throughout much of the year, making it one of the longest negative stretches recorded for the metric.
Bitcoin price technical analysis
On the price chart, Bitcoin appears to be stabilizing after a steep fall earlier in the year. The drop began in the $95,000–$100,000 range and eventually pushed the price down to around $63,000, where buyers finally stepped in.
Since reaching that level, price movement has been largely sideways. This type of behavior often signals that selling pressure is easing while demand slowly returns.
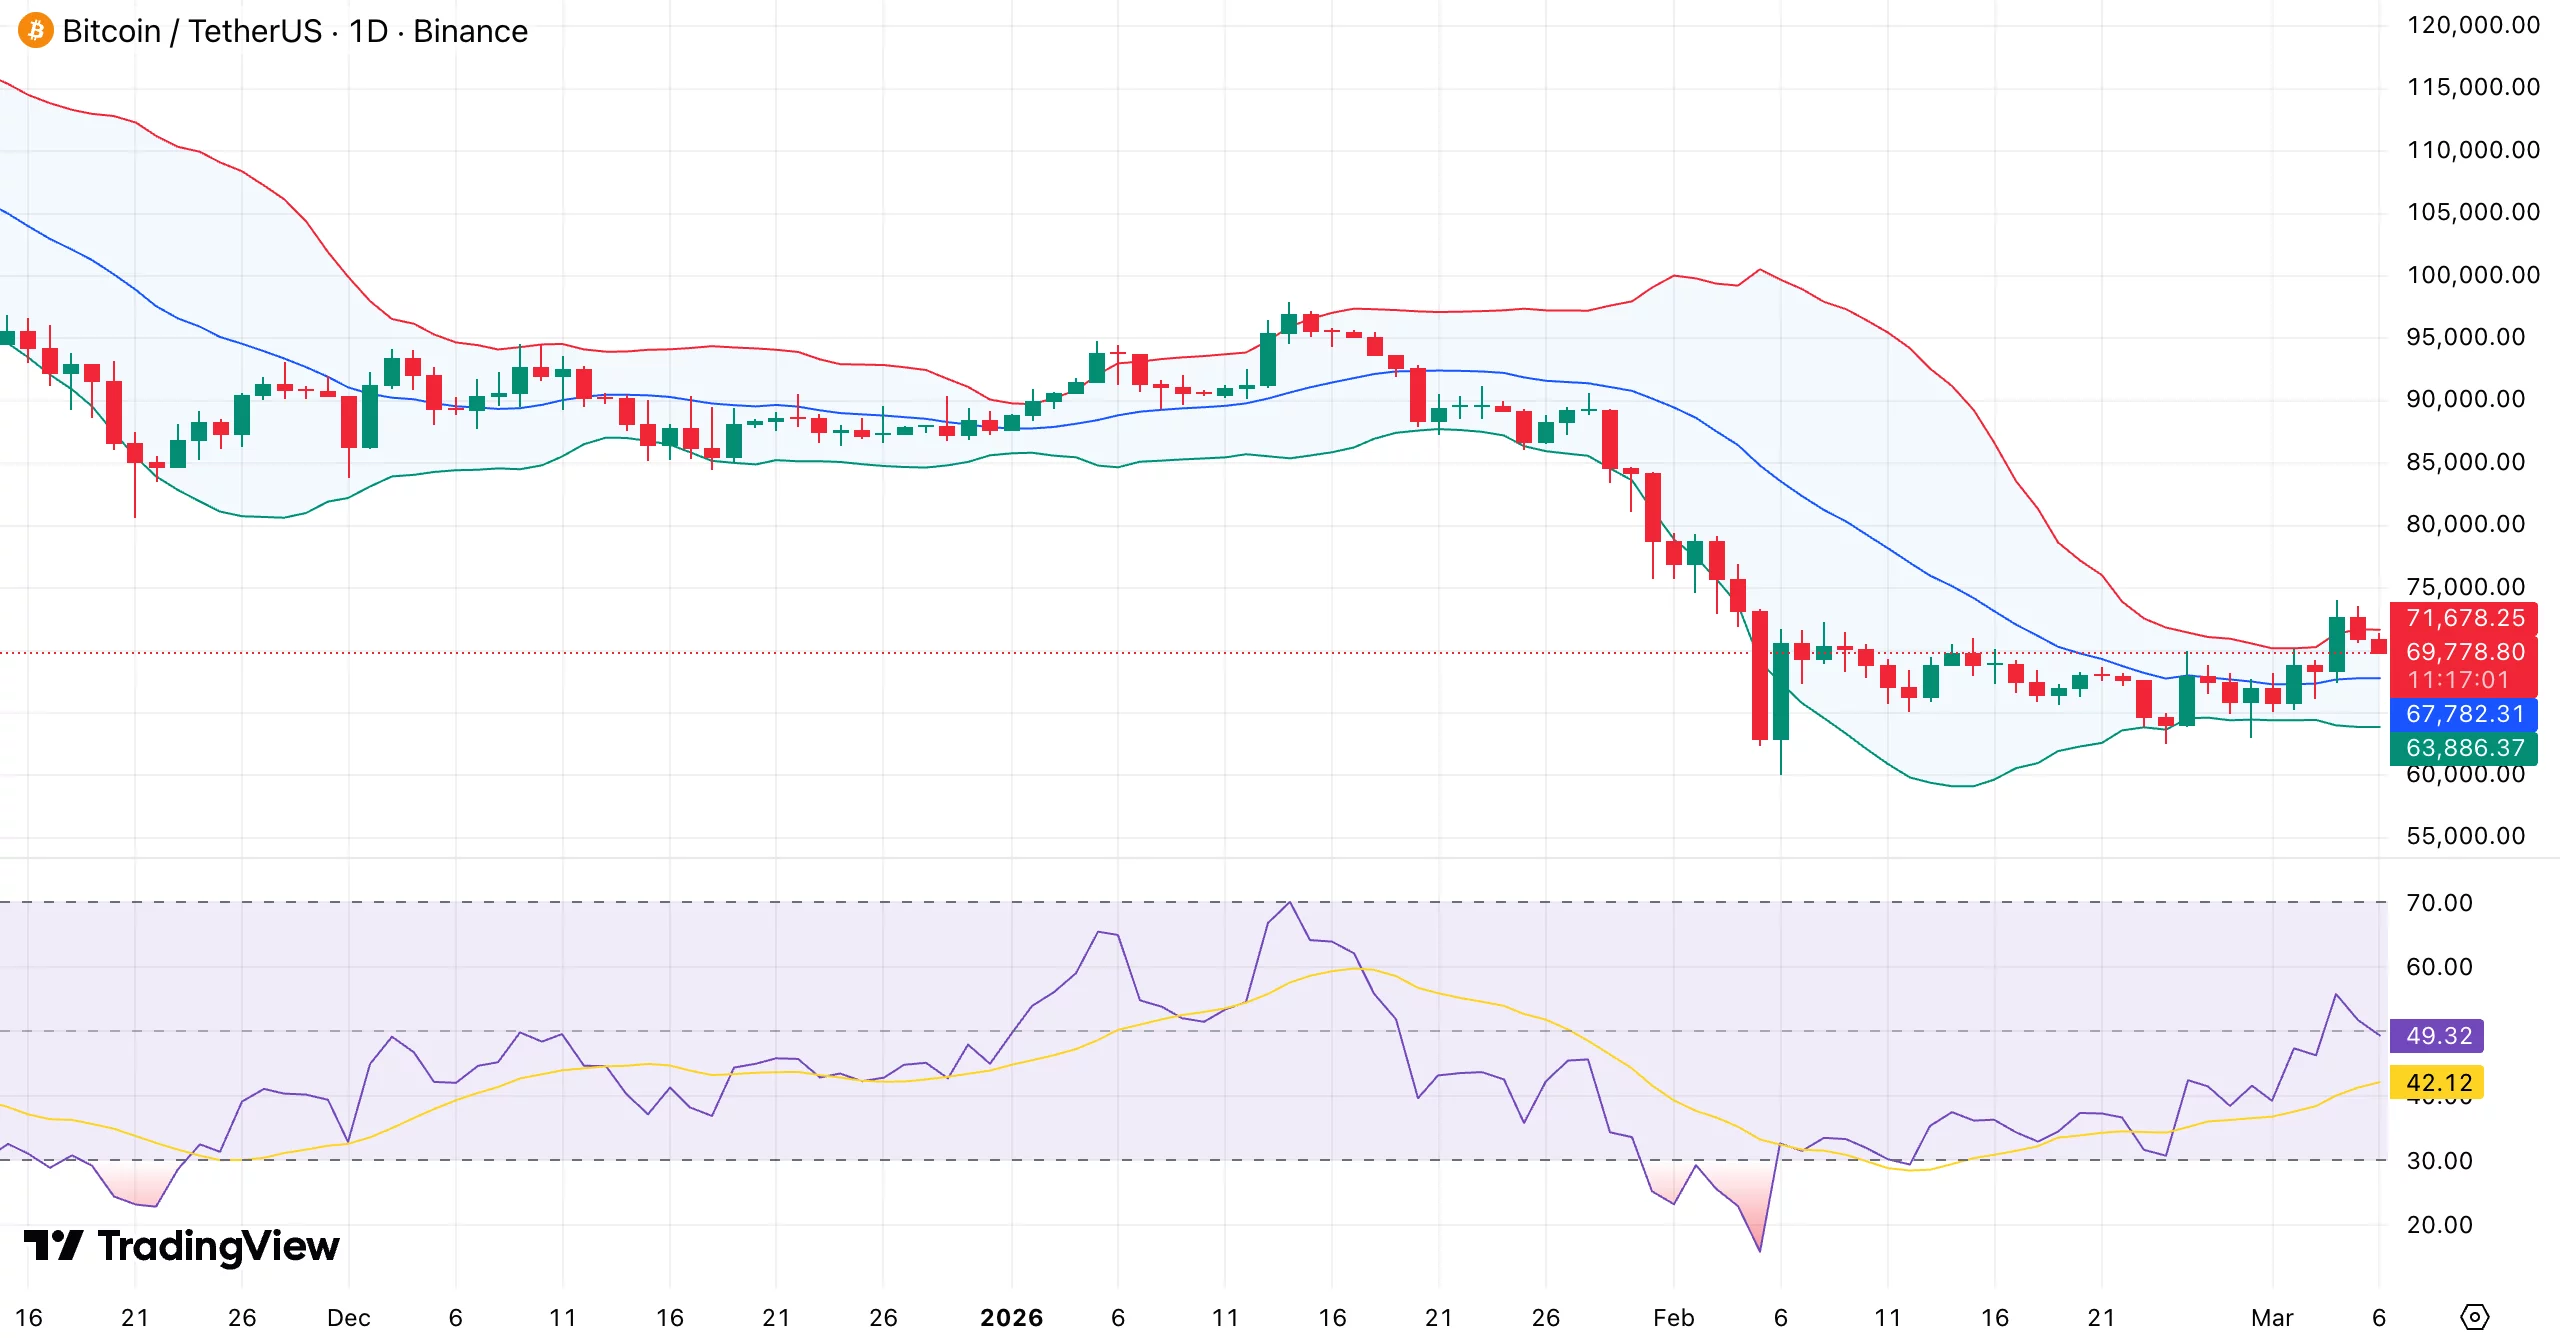
For several weeks now, BTC has traded within a relatively tight corridor between $67,000 and $72,000. Markets often behave this way during accumulation phases, when participants quietly re-position before the next significant move.
The immediate hurdle sits at $72,000. If buyers manage to push the price above that level and secure a strong daily close, a breakout from the range could follow. In that case, attention would likely shift toward the $75,000–$78,000 region, where another supply zone is expected.
Below the current price, support continues to hold around $67,000. A deeper demand area can be found near $63,000, the same region that previously stopped the earlier sell-off.
That dip toward $63,000 may not have been accidental. In many markets, prices briefly fall below a key support level to trigger stop-loss orders before reversing direction.
This type of move is often referred to as a liquidity sweep. Bitcoin quickly rebounded after touching that area, reclaiming $67,000 soon afterward as buying pressure absorbed the sell-off.
Volatility has also been shrinking as the range tightens. Historically, quieter phases like this tend to precede stronger directional moves.
A breakout above $72,000 would likely strengthen bullish momentum and open the path toward higher resistance levels. On the other hand, losing support at $67,000 could weaken the recovery structure and bring the $63,000 demand zone back into focus.