Architectural Concept Design Collection

  • CONTACT
  • MARKETCAP
  • BLOG
Finances Investing and Crypto News
  • BOOKMARKS
  • Finance
  • Investment
  • Crypto
    • Bitcoin
    • Blockchain
    • Ethereum
    • Forex
    • Tether
  • Market
    • Binance
    • Business
    • Investor
    • Money
    • Trading
  • News
    • Mining
    • NFT
    • Stocks
Reading: these 4 charts show why
Share
  • bitcoinBitcoin(BTC)$117,340.83
  • ethereumEthereum(ETH)$3,751.65
  • rippleXRP(XRP)$3.45
  • tetherTether USDt(USDT)$1.00
  • binancecoinBNB(BNB)$757.09
  • solanaSolana(SOL)$180.50
  • usd-coinUSDC(USDC)$1.00
  • dogecoinDogecoin(DOGE)$0.274739
  • cardanoCardano(ADA)$0.86
  • tronTRON(TRX)$0.313704
Finances Investing and Crypto NewsFinances Investing and Crypto News
0
Font ResizerAa
  • Finance
  • Investment
  • Crypto
  • Market
  • News
Search
  • Finance
  • Investment
  • Crypto
    • Bitcoin
    • Blockchain
    • Ethereum
    • Forex
    • Tether
  • Market
    • Binance
    • Business
    • Investor
    • Money
    • Trading
  • News
    • Mining
    • NFT
    • Stocks
Have an existing account? Sign In
Follow US
© Foxiz News Network. Ruby Design Company. All Rights Reserved.
Finances Investing and Crypto News > Blog > Crypto > Ethereum > these 4 charts show why
EthereumMarket

these 4 charts show why

admin
Last updated: 14/07/2025 9:06 Chiều
admin
Published 14/07/2025
Share


Contents
1. Ethereum price forms a golden cross pattern2. ETH supply on exchanges is falling3. Ethereum whale accumulation4. Ethereum ETF inflows

Ethereum price has staged a strong comeback in the past few days as the crypto market rally intensified. 

Ethereum (ETH) surged to $3,050 on Monday, its highest level since February 2 and 120% above its lowest point in April. This article highlights four charts that explain why it is soaring.

1. Ethereum price forms a golden cross pattern

The daily chart shows why ETH has rebounded strongly. The rally followed the formation of a bullish flag pattern, which includes a vertical pole and a rectangle-shaped consolidation. ETH has now broken above the upper boundary of the flag.

Ethereum has also formed a golden cross pattern, as the 50-day and 200-day Exponential Moving Averages crossed each other. A golden cross is widely considered a highly bullish technical signal.

The Average Directional Index has also rallied to 24, its highest level since June 7. An ADX reading above 20 typically indicates strong trend momentum. These signals point to a potential move toward $4,000.
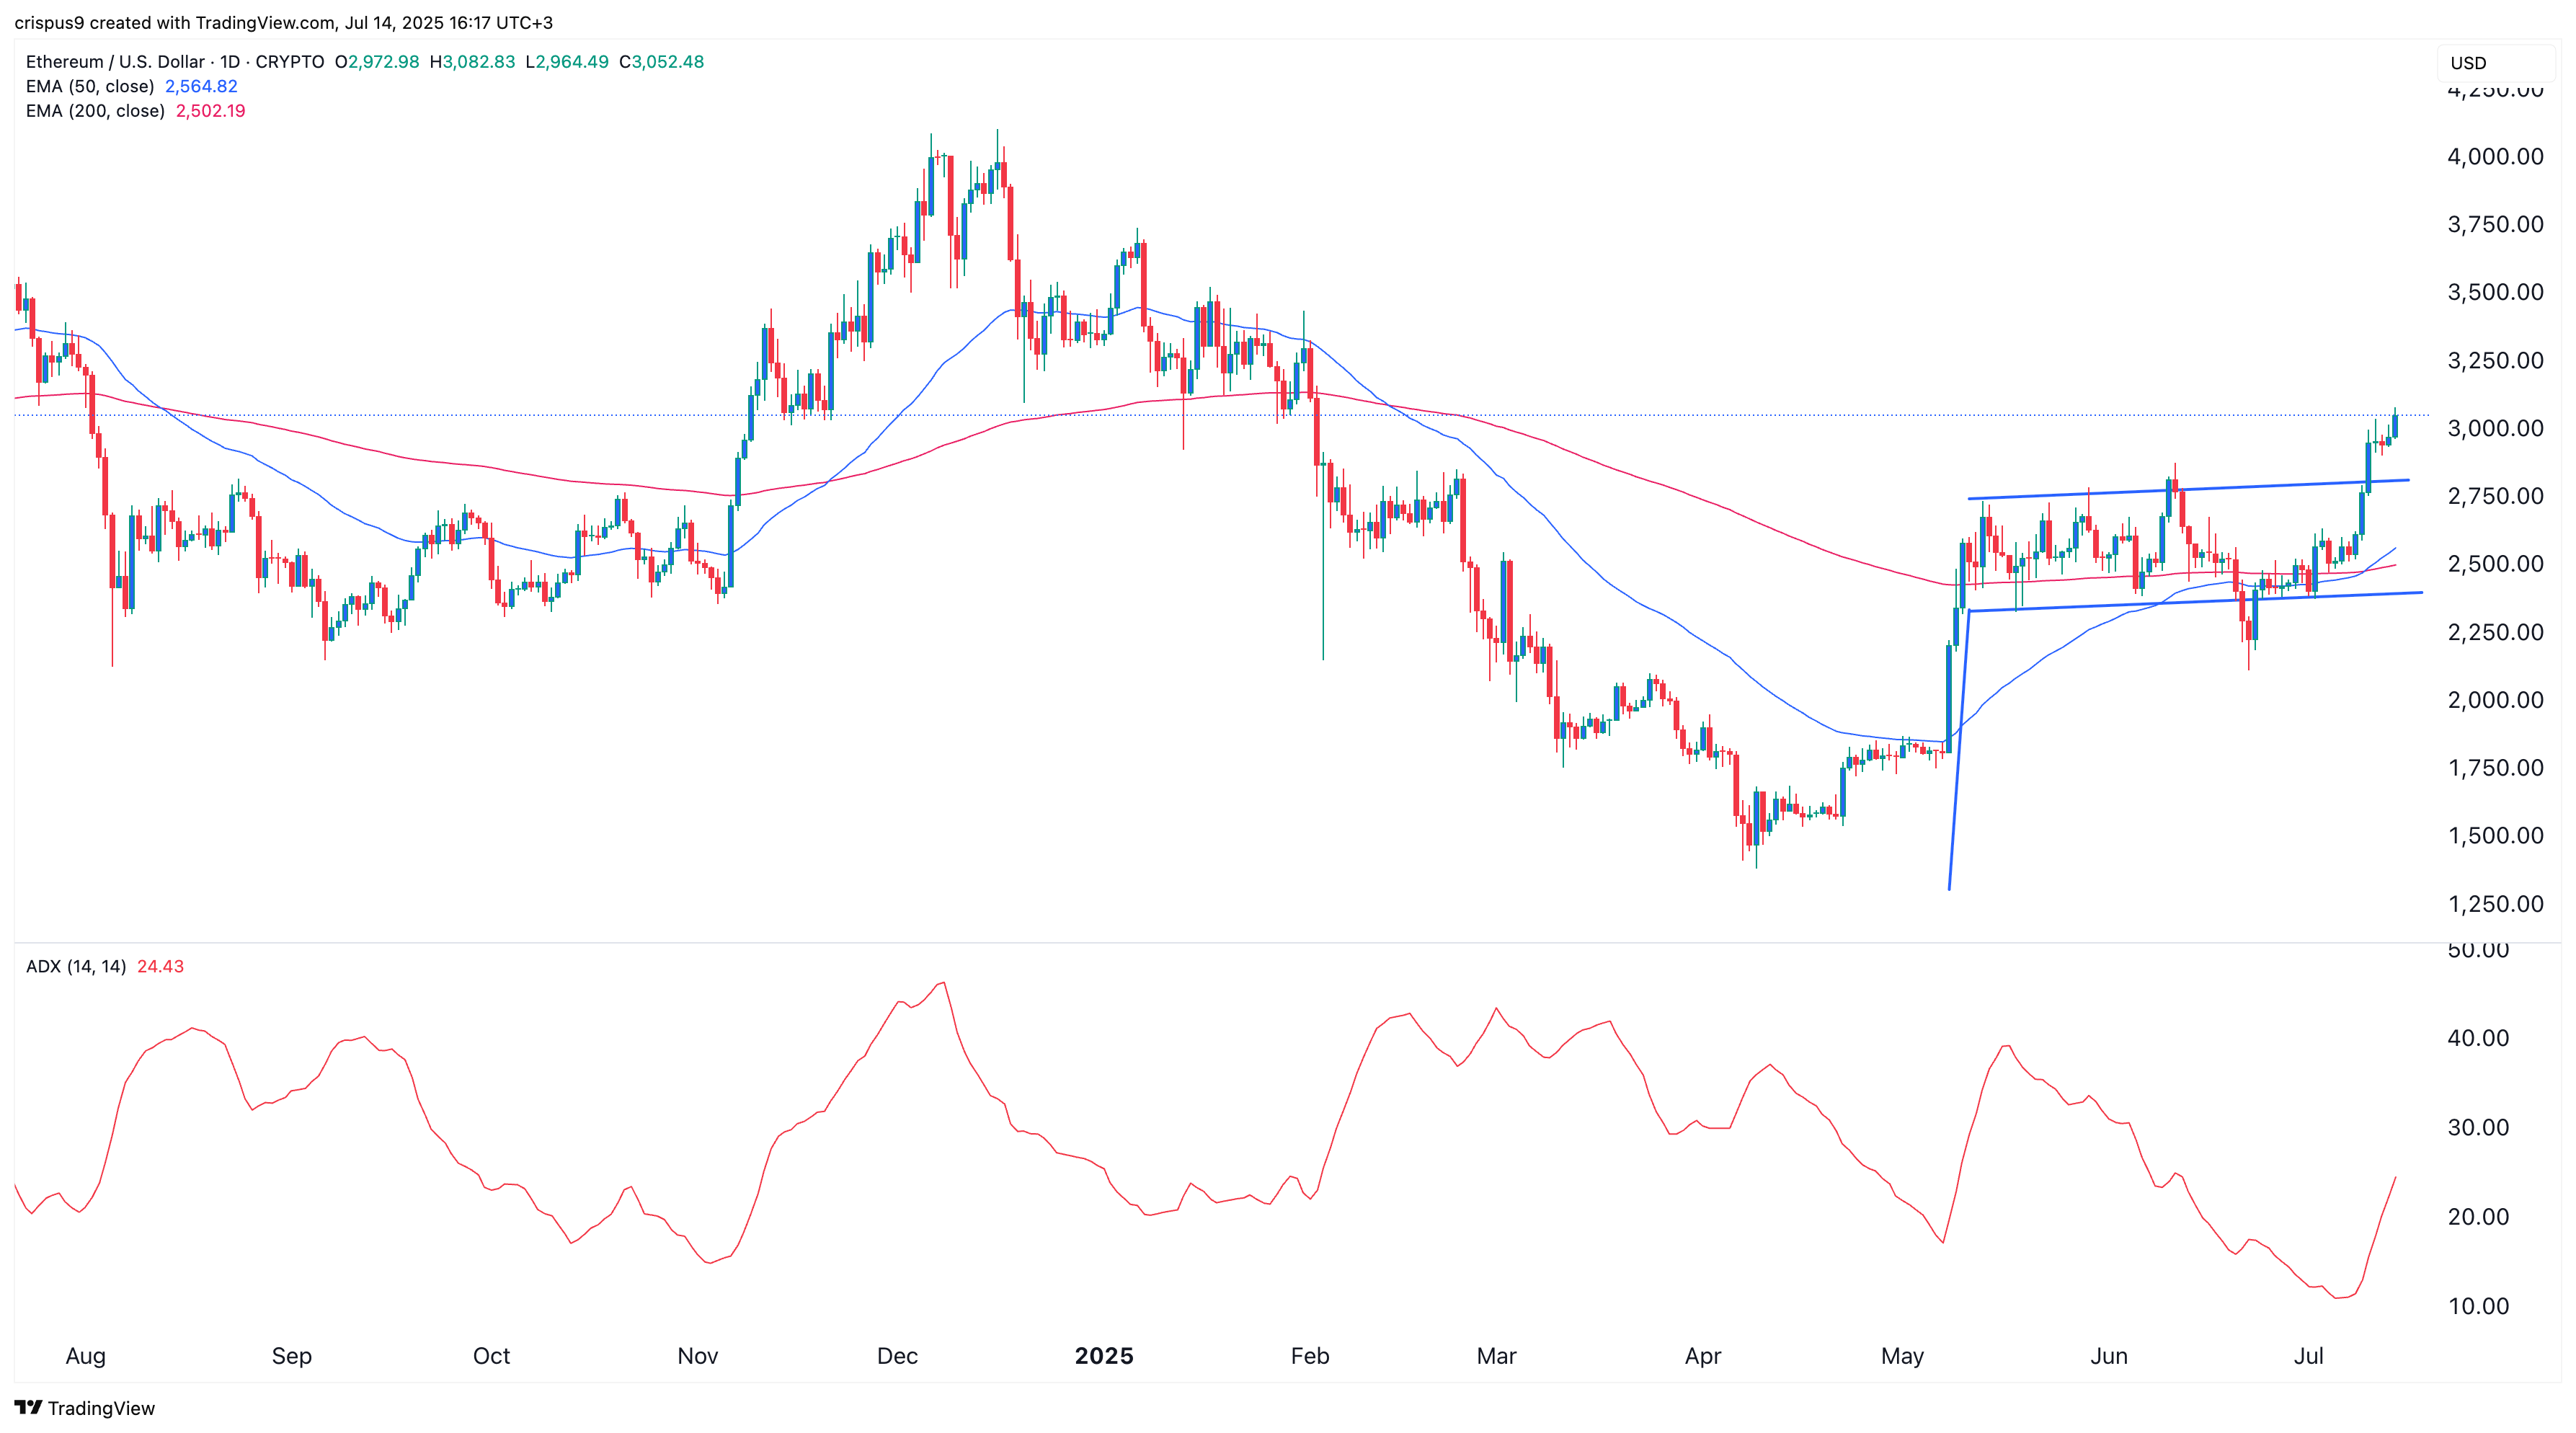
ETH price technical chart
ETH price technical chart | Source: crypto.news

2. ETH supply on exchanges is falling

The chart below shows that Ethereum’s supply on exchanges has declined steadily this year. There are currently 7.29 million tokens on exchanges, down from a year-to-date high of 10.73 million.

Declining exchange balances suggest that investors are moving coins into self-custody. This behavior is often seen as bullish, signaling expectations of further price appreciation.
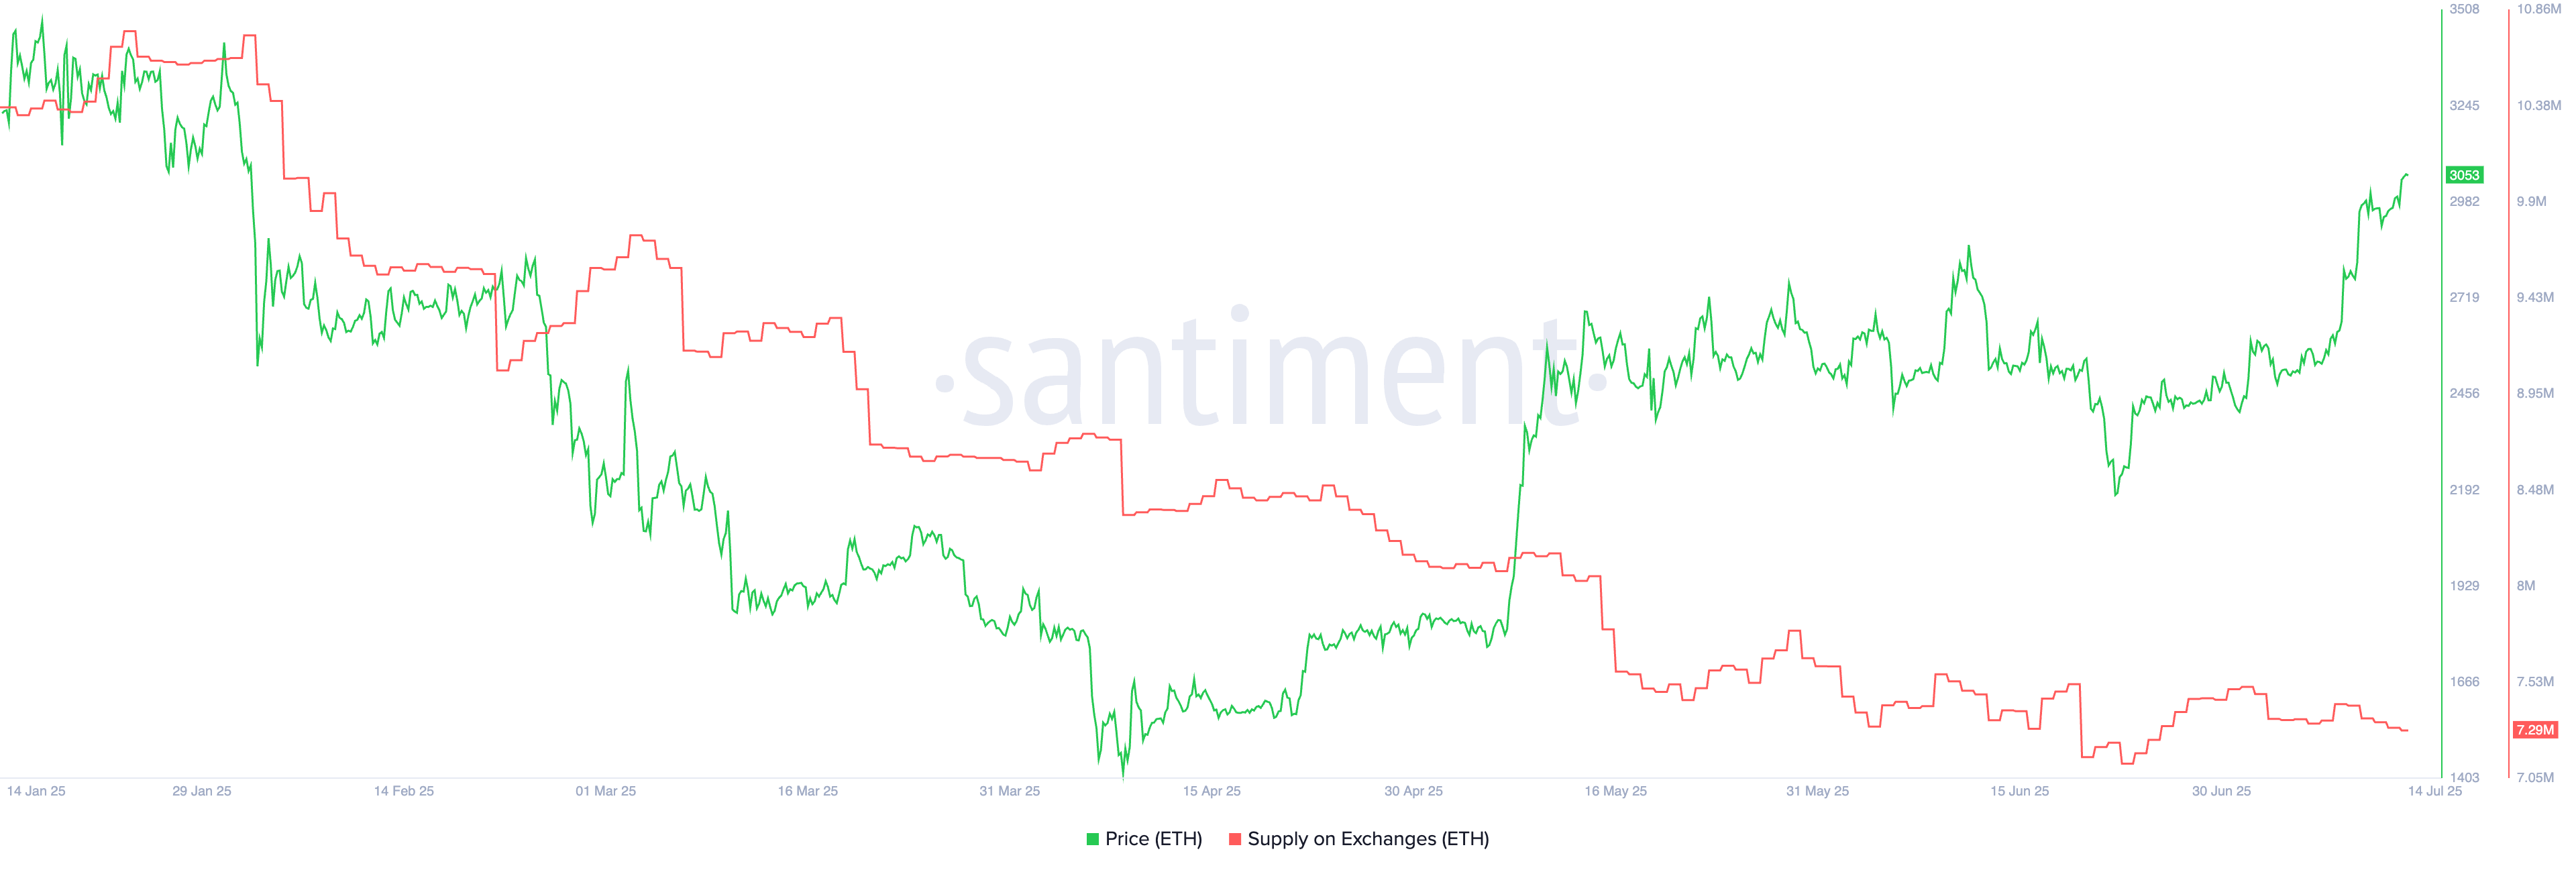
ETH supply balances are falling
ETH supply balances are falling | Source: Santiment

3. Ethereum whale accumulation

Meanwhile, the next chart shows that whales or large investors have continued buying Ethereum. Whales and smart money investors are widely seen as being more experienced investors. 

Wallets holding between 10,000 and 100,000 ETH have continued to grow their positions this year. These addresses now hold 27 million coins, up from a March low of 24.65 million.

Similarly, wallets holding between 10 million and 100 million ETH now hold 64 million coins, up from 55.8 million in January. Ongoing whale accumulation is a bullish signal. Historically, major sell-offs tend to follow periods of whale distribution.
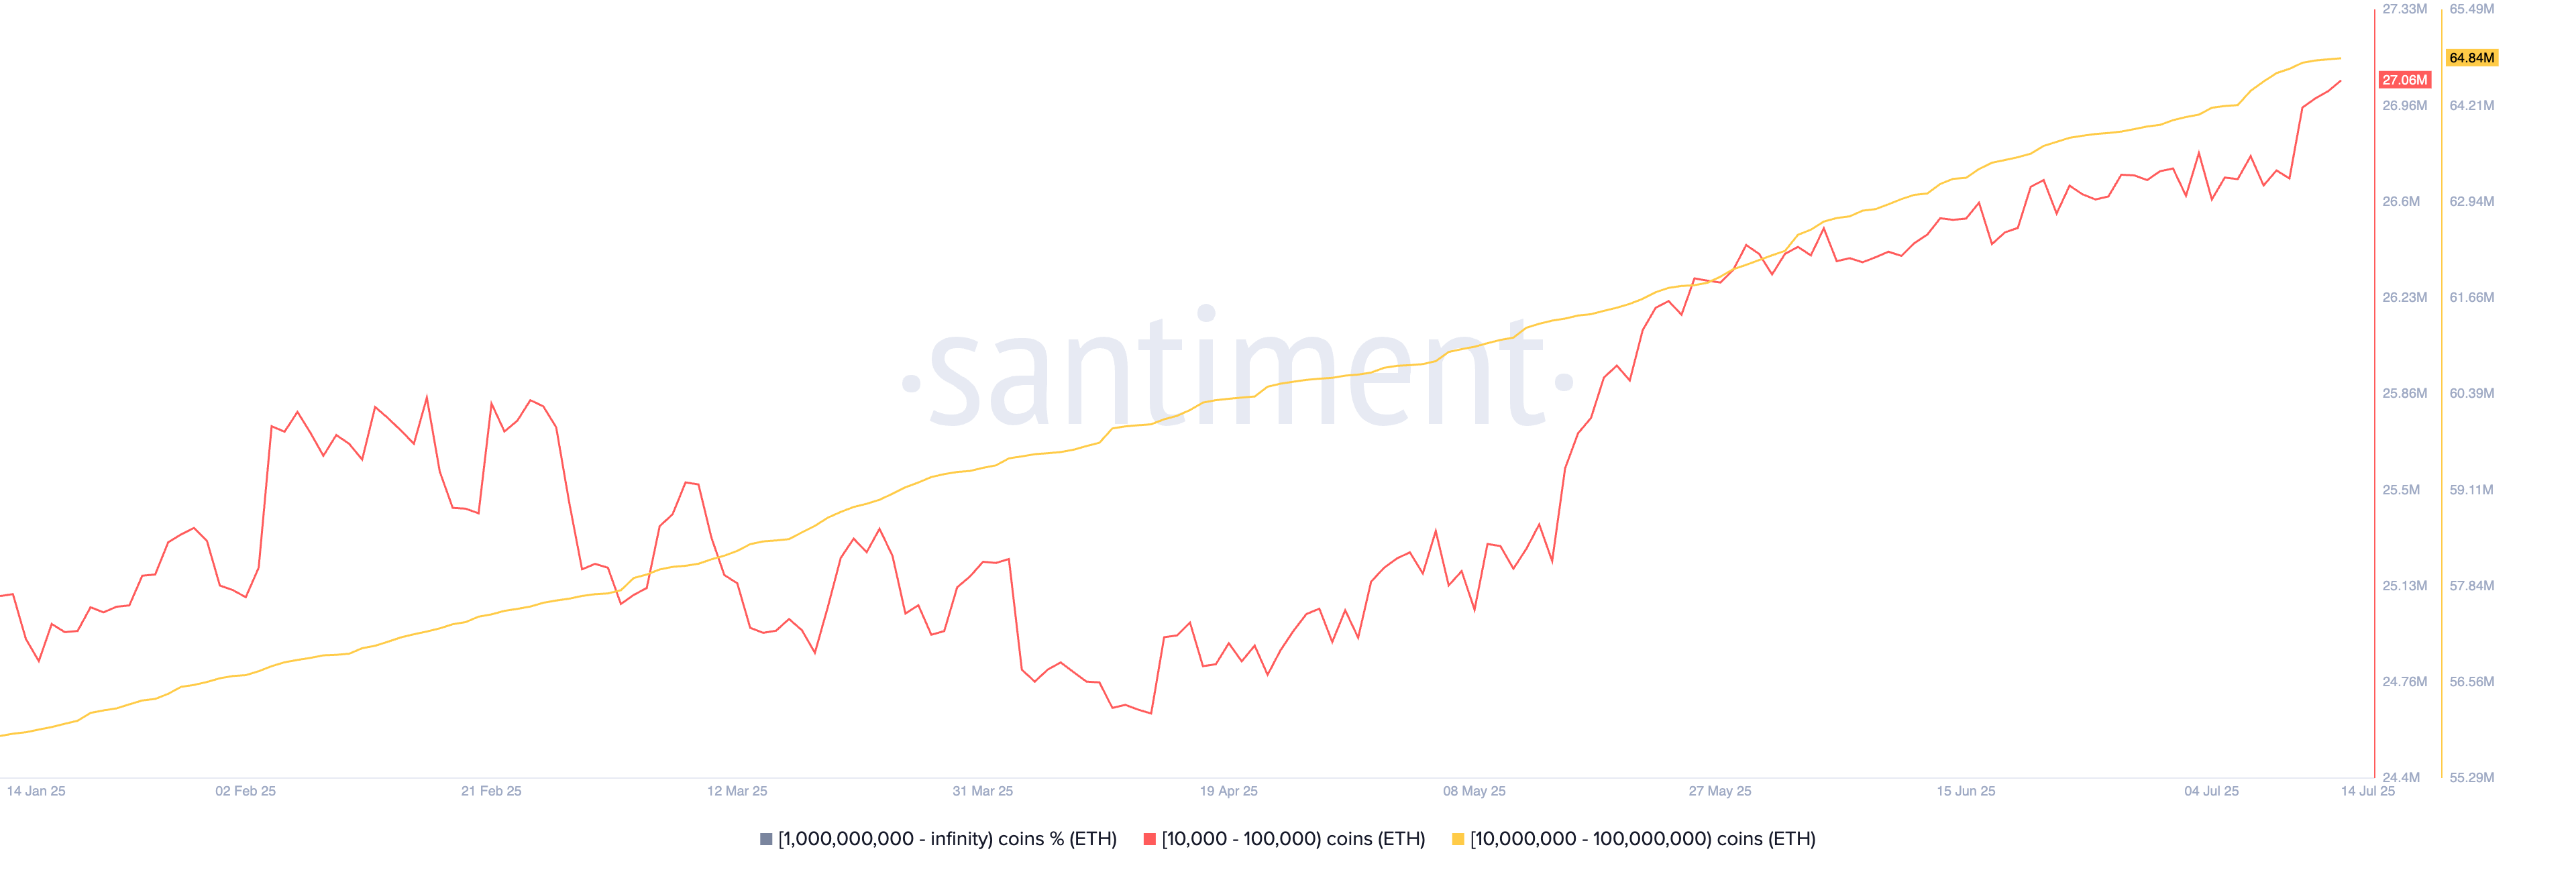
ETH whale accumulation
ETH whale accumulation | Source: Santiment

4. Ethereum ETF inflows

Wall Street investors have also ramped up Ethereum accumulation through ETFs. These funds have recorded inflows for nine consecutive days, bringing cumulative assets to over $5.3 billion. Total ETH ETF holdings now stand at $13.5 billion, representing 3.7% of the current market cap.
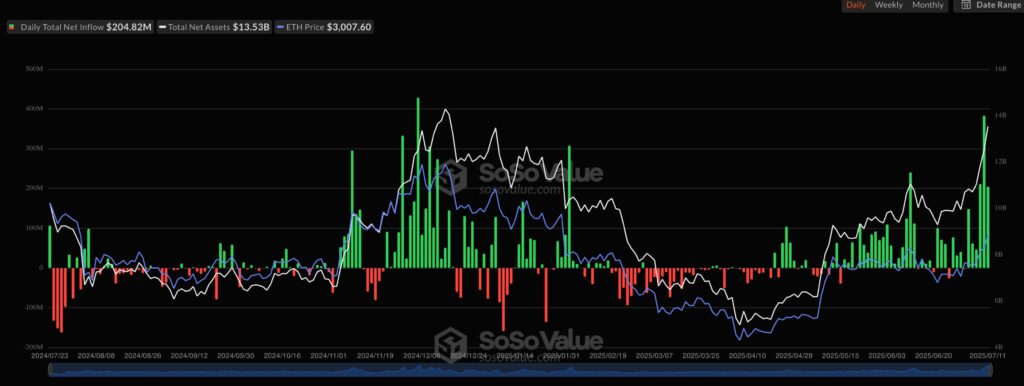
Ethereum price is soaring: these 4 charts show why - 1
ETH ETF inflows | Source: SoSoValue

Several additional data points support Ethereum’s ongoing rally. For instance, the stablecoin market cap has surged to a record high above $127 billion, while the total value locked (TVL) in DeFi protocols has spiked to over $160 billion.

Another notable metric: Ethereum open interest has soared to a record high of nearly $45 billion.

You Might Also Like

Ethereum rallies 20%, ETH now undervalued relative to BTC

Solana, XRP, Cronos crypto included in new Trump’s ‘blue chip’ ETF

Ethereum exchange supply now at 10-year low as whales load up

PayPal to launch its stablecoin PYUSD on Stellar

Fartcoin eyes new all-time high, key support at $1.05 must hold

TAGGED:chartsshow

Sign Up For Daily Newsletter

Be keep up! Get the latest breaking news delivered straight to your inbox.
By signing up, you agree to our Terms of Use and acknowledge the data practices in our Privacy Policy. You may unsubscribe at any time.
Share This Article
Facebook Email Copy Link Print
Previous Article Bitget goes live at MotoGP Germany with immersive Web3 racing zone
Next Article Dow slips 100 points as Wall Street weighs CPI, tariffs
Leave a Comment

Để lại một bình luận Hủy

Email của bạn sẽ không được hiển thị công khai. Các trường bắt buộc được đánh dấu *

Follow US

Find US on Socials
FacebookLike
- Advertisement -
Ad image
Popular News
3 crypto tokens to surprise traders
Emergency Funds: Importance and How to Build One
Debt Management: Strategies to Pay Off Debt Efficiently
Riot Platforms unloads 475 BTC in its biggest single-month Bitcoin sale to date
Revolut partners with Lightspark to add Bitcoin Lightning for UK and EEA users
- Advertisement -
Ad image

Follow Us on Socials

We use social media to react to breaking news, update supporters and share information

Twitter Youtube Telegram Linkedin
Finances Investing and Crypto News

FICN.net brings you the latest in finance, investment, and crypto. Stay informed with expert insights, market analysis, and beginner guides. Whether you're new or experienced, FICN.net helps you explore opportunities, manage risks, and make smarter financial decisions in a fast-changing world.

Subscribe to our newsletter

You can be the first to find out the latest news and tips about trading, markets...

Ad image
© 2024 Finance, Investment, and Crypto News. All Rights Reserved.
Welcome Back!

Sign in to your account

Username or Email Address
Password

Lost your password?