
Bitcoin has entered a bearish channel after slipping below key support levels as ETF outflows, rising oil prices, and renewed geopolitical uncertainty weighed on market sentiment.
Summary
- Bitcoin has fallen into a bearish channel as more than $2.4 billion exits spot ETFs, and traders defend the key $72,000 support zone.
- Rising oil prices above $90 and renewed U.S.-Iran military tensions have added pressure to risk assets, including Bitcoin.
- Analysts warn that a break below $72,650 could expose Bitcoin to further downside, with the next major demand zone between $54,300 and $51,000.
According to crypto.news data, Bitcoin (BTC) traded near $72,700 at press time after briefly falling toward the $72,600 region during early Monday trading. It remains down nearly 1.5% in the past 24 hours, 6% over the past week and 10% from May highs near $81,000, placing the crypto back near a major support zone that traders have closely monitored throughout the year.
Institutional demand has weakened considerably during the recent pullback. Data from SoSoValue shows that spot Bitcoin ETFs recorded $1.42 billion in net outflows over the past week, adding to more than $2.4 billion in withdrawals seen throughout May.
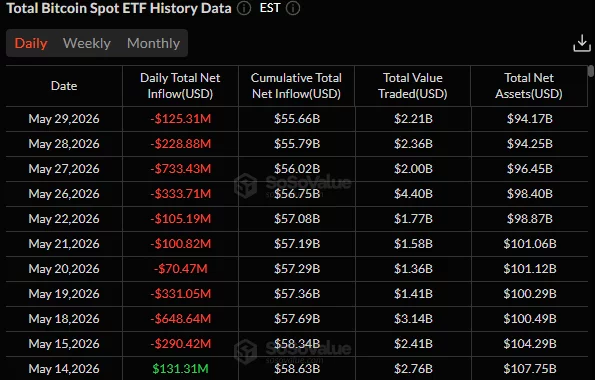
The persistent redemptions have removed a major source of buying pressure and forced ETF issuers to sell underlying Bitcoin holdings into an already fragile market.
Fresh geopolitical concerns added another layer of uncertainty over the weekend. The U.S. military said it carried out strikes against Iranian radar and drone facilities in the city of Goruk and on Qeshm Island after Iran allegedly downed a U.S. MQ-1 drone operating over international waters. The operation targeted air-defense systems, a drone control station, and two attack drones, according to U.S. Central Command.
The military action arrived as Washington and Tehran continued exchanging proposals to extend their ceasefire agreement and reopen shipping through the Strait of Hormuz. With no formal breakthrough announced, traders remained focused on the possibility of further disruptions across one of the world’s most important energy corridors.
Oil markets reacted quickly. WTI crude futures climbed nearly 4% above $90 per barrel, recovering part of last week’s losses as uncertainty clouded prospects for a lasting agreement.
U.S. President Donald Trump also reiterated demands that Iran halt its nuclear program and fully restore unrestricted access through the Strait of Hormuz.
Higher energy prices have renewed concerns that inflation may remain elevated for longer than previously expected. A prolonged rise in oil prices could complicate the Federal Reserve’s path toward monetary easing, reducing the likelihood of near-term rate cuts and creating a less favorable environment for speculative assets such as cryptocurrencies.
Market observers have reported increased spot distribution from whales and long-term holders locking in profits after Bitcoin’s rally earlier this year. The reduction in institutional inflows combined with profit-taking activity has left the market vulnerable to sharp downside moves whenever macroeconomic concerns intensify.
Not all prominent Bitcoin advocates have turned cautious. While Strategy has hinted at further Bitcoin purchases, investor and author Robert Kiyosaki recently urged market participants to prioritize financial education rather than blindly follow market narratives. Kiyosaki argued that even assets traditionally viewed as safe investments can generate losses when purchased without proper timing or understanding.
Technical structure places $72K support under pressure
Bitcoin’s technical outlook has deteriorated after BTC price broke below a descending trendline that has guided lower highs since May. The daily chart shows BTC trading within a bearish channel, with sellers repeatedly defending recovery attempts before the asset can reclaim major resistance levels.
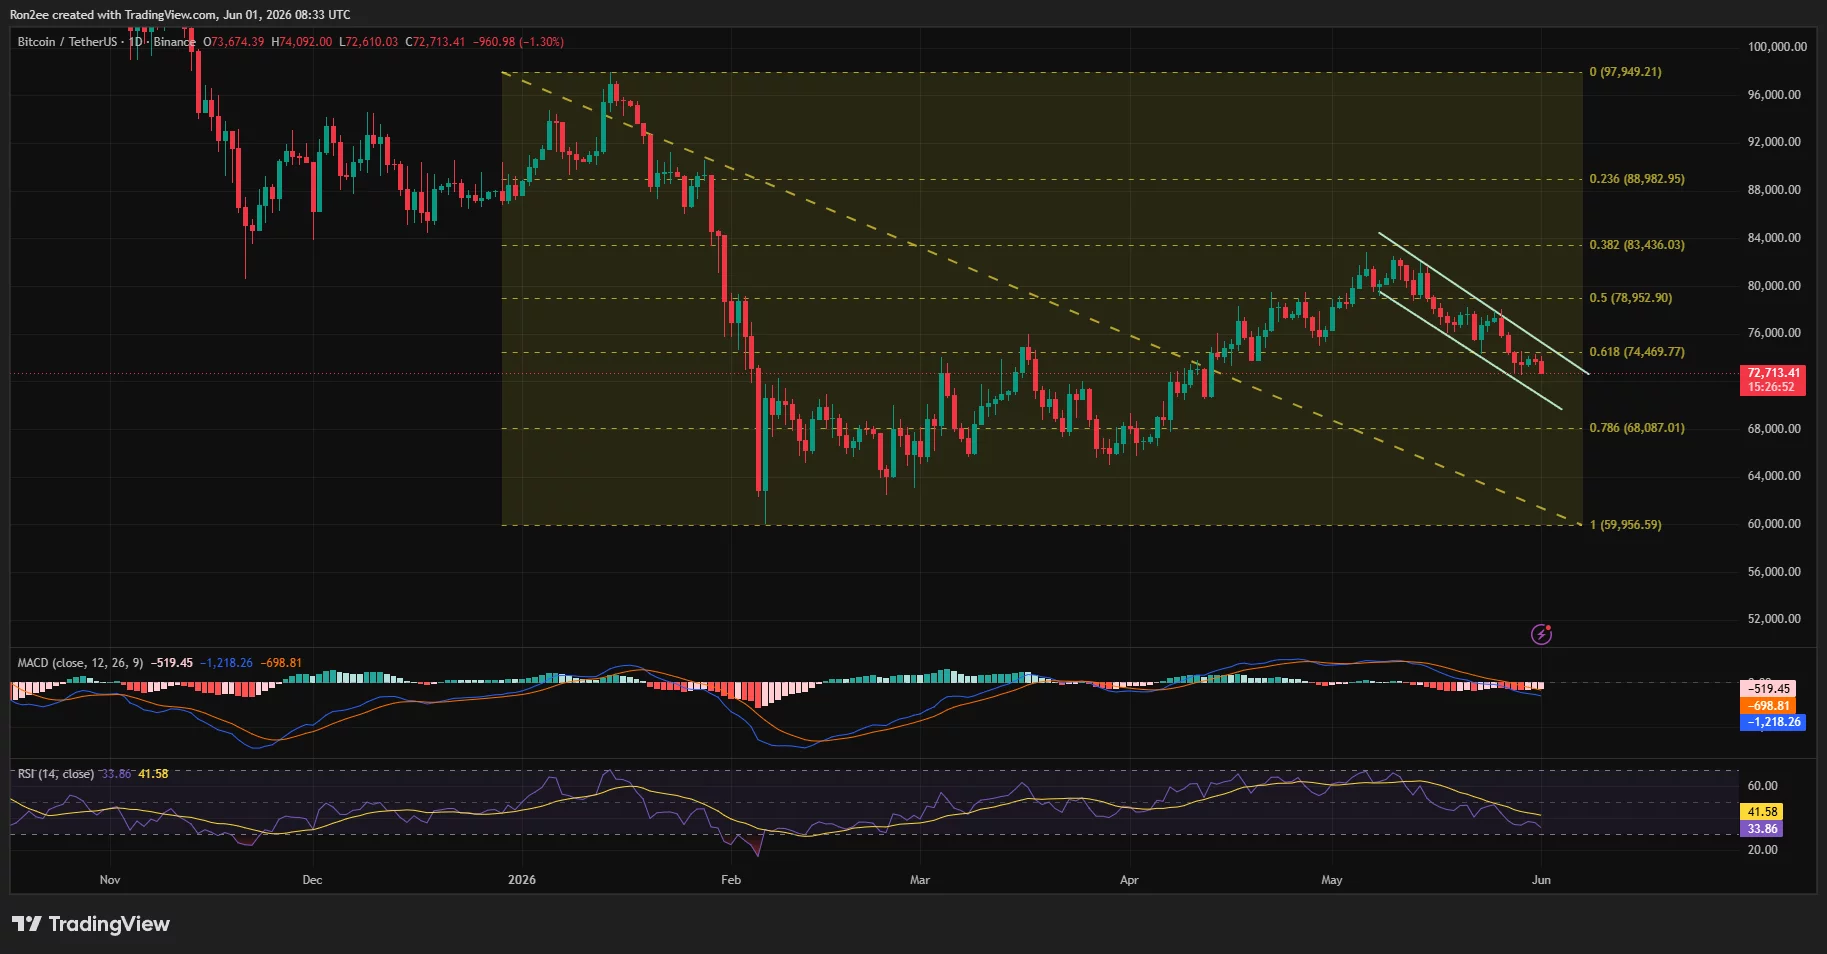
A key Fibonacci retracement structure drawn from the January peak near $97,900 to the February low around $59,950 places Bitcoin directly beneath the 0.618 retracement level at roughly $74,470. The rejection from that zone during May reinforced it as a significant resistance area. Price now sits between the 0.618 and 0.786 retracement levels, with the latter located near $68,100.
Momentum indicators continue to favor sellers. The daily MACD has crossed into negative territory, while the RSI has fallen toward 41, placing momentum firmly below neutral conditions. Neither indicator currently shows evidence of a bullish reversal.
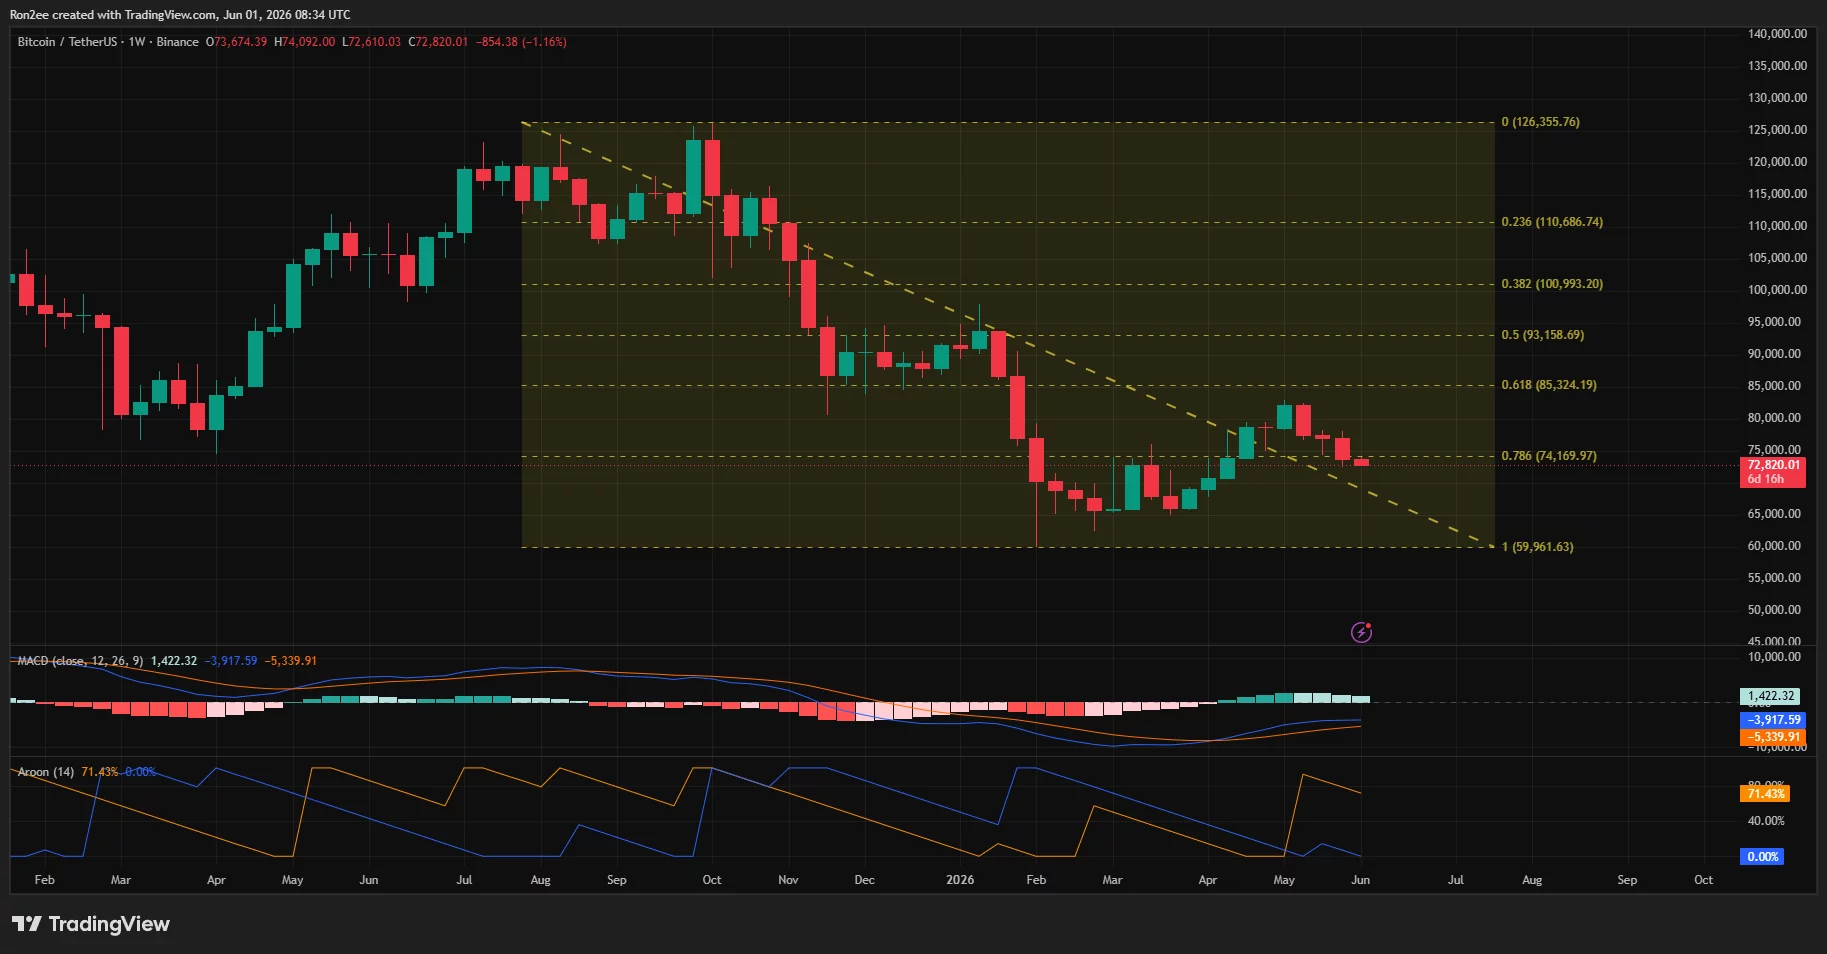
The weekly timeframe presents a similar picture. Bitcoin recently failed to hold above the 0.786 Fibonacci retracement level near $74,170 and has drifted back toward support around $72,000. Aroon readings remain heavily skewed toward downside momentum, with the Aroon Down indicator dominating the higher timeframe trend.
Derivatives positioning suggests volatility could increase if support gives way. CoinGlass liquidation data shows one of the largest leverage clusters concentrated between $72,000 and $72,500. Large pockets of long liquidations sit directly beneath current prices, creating conditions for another wave of forced selling if the support area breaks.
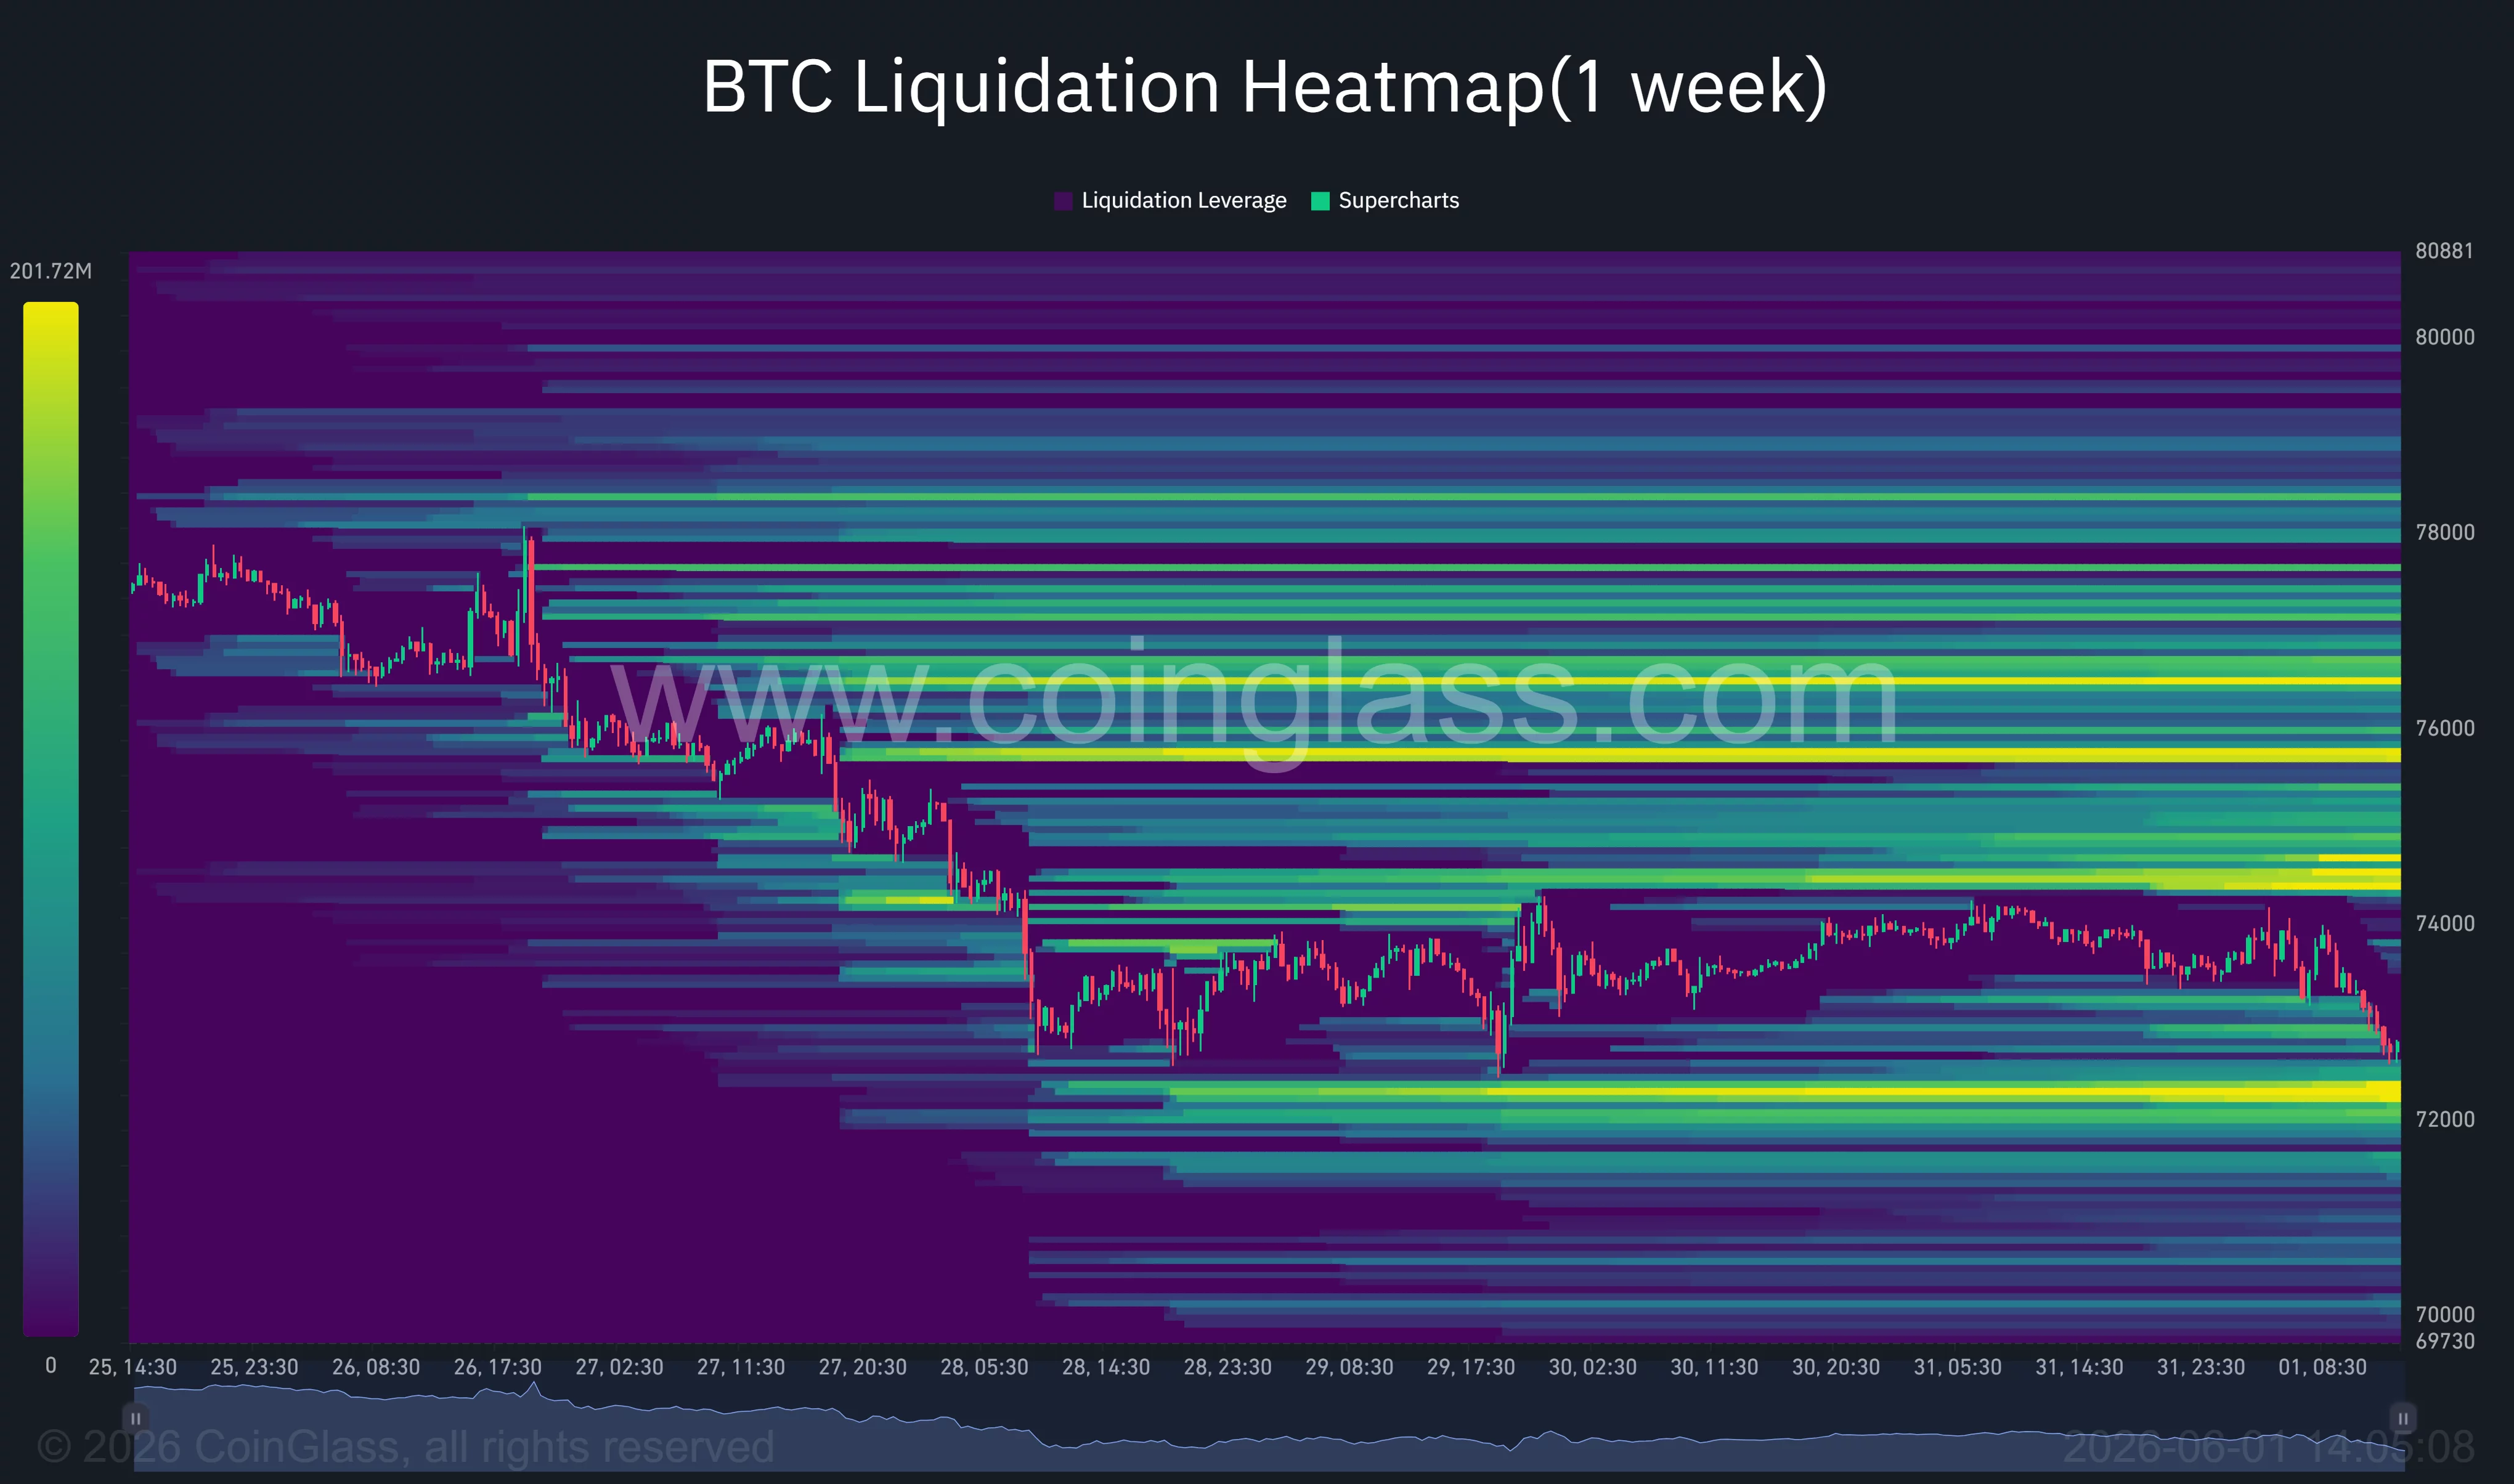
The liquidation heatmap also highlights substantial short positions between $74,500 and $76,000. Those levels may attract price in the event of a relief rally, though the concentration of liquidity above current levels does not necessarily imply a trend reversal.
According to crypto analyst Ali Martinez, Bitcoin is approaching a make-or-break support area near $72,650 that has historically attracted strong demand from investors.
“I’m watching $72,650 closely on Bitcoin, as the MVRV Pricing Bands continue to identify it as a critical support level. If it fails, the next major demand zone sits between $54,300 and $51,000.”
The analyst’s assessment aligns with the weakening market structure visible across higher timeframes, where several previous support levels have already been converted into resistance.
A separate market update from Team Lambo offered a more balanced view. The group noted that Bitcoin remains inside a broader demand zone despite recent weakness and highlighted the importance of reclaiming resistance near $75,600 to revive bullish momentum.
According to the analysts, a confirmed peace agreement between the United States and Iran could provide the catalyst needed for a recovery attempt.
ETF demand and geopolitical developments remain key invalidation factors
The most immediate risk to the bearish outlook remains a reversal in institutional flows. Bitcoin’s latest decline has coincided with one of the largest ETF withdrawal periods of 2026. A return to sustained inflows would remove a major source of spot-market selling and could stabilize price action around current levels.
Geopolitical developments may also change sentiment quickly. Any formal agreement extending the ceasefire between the United States and Iran while guaranteeing unrestricted shipping through the Strait of Hormuz could reduce energy-market fears and improve demand for risk assets.
From a technical standpoint, Bitcoin would need to reclaim the $74,500-$75,600 region to weaken the current bearish structure. A move above that area would place the price back above the 0.618 Fibonacci retracement level and open the door to a retest of resistance near $79,000.
Failure to defend $72,000, however, could trigger a more aggressive liquidation event. The heatmap suggests substantial leveraged positions remain exposed below current prices, while the daily chart identifies the $68,000 region as the next major technical support. Below that level, attention could shift toward the $54,000-$51,000 demand zone highlighted by MVRV pricing models.
Disclosure: This article does not represent investment advice. The content and materials featured on this page are for educational purposes only.